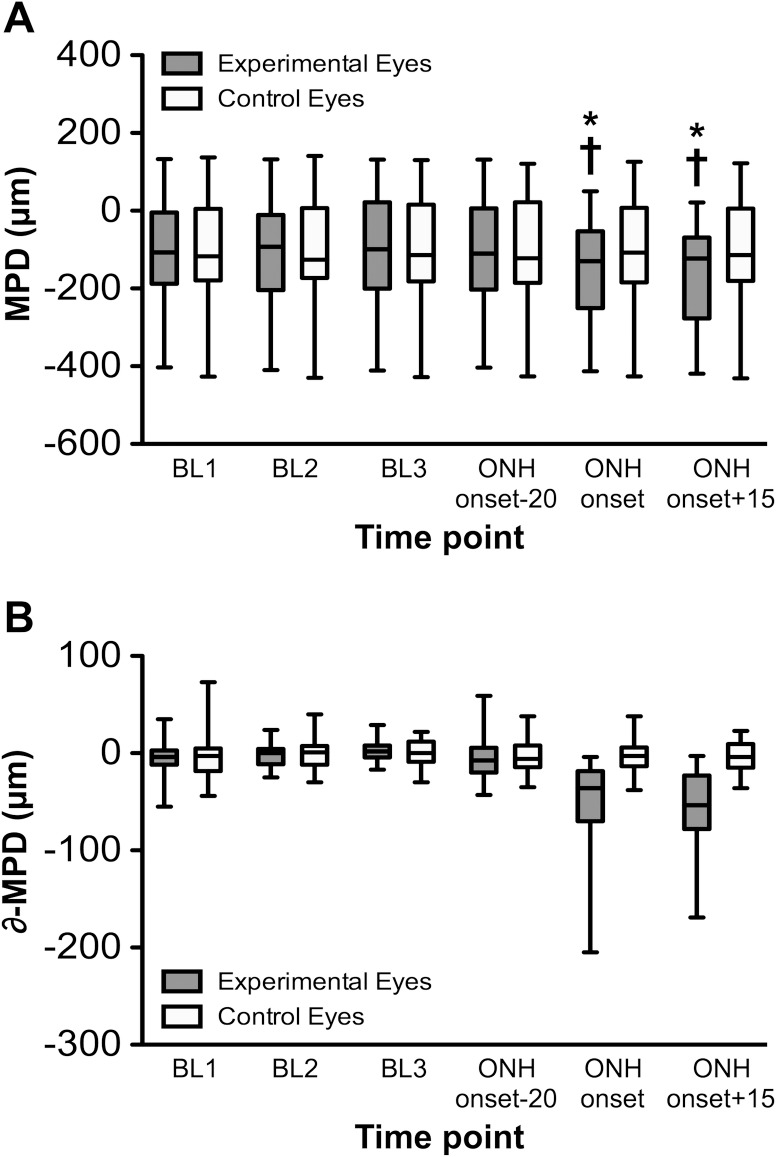
Figure 2. .
(A) The CSLT parameter MPD versus time for entire group. Box plots represent distribution of MPD values (median, interquartile range, and extremes) for the three BL sessions as well as the session where ONH surface topography onset occurred for each EG eye and the next nearest session prior to and after ONH surface topography onset (which occurred a median of 20 days prior and 15 days after ONH surface change onset, respectively). (B) MPD values normalized to the BL average for each eye and plotted as the difference from BL versus time. *P < 0.0001 versus each BL; †P < 0.0001 versus the session just prior to ONH onset (median of 20 days prior).

