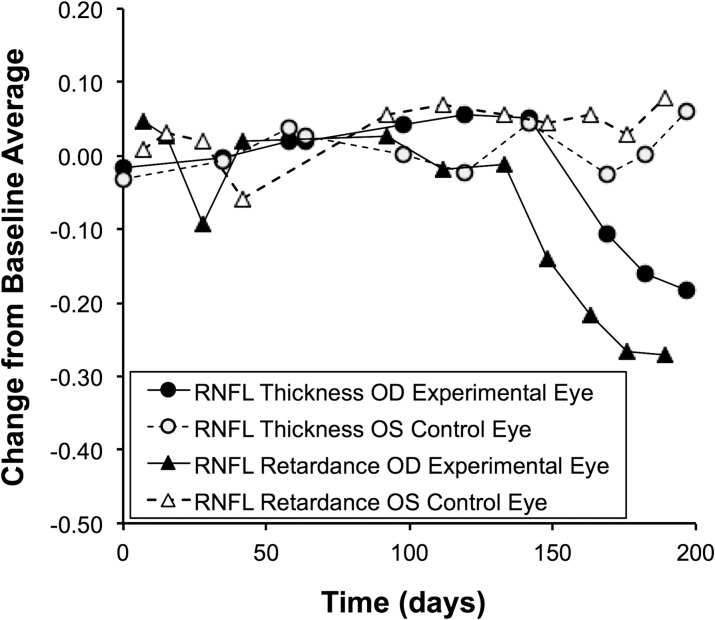
Figure 3. .
RNFL retardance and thickness versus time for the individual example animal shown in Figure 1. SLP measurements of RNFL retardance and SD-OCT measurements of RNFL thickness are normalized to the baseline average and plotted versus time as change from baseline.

