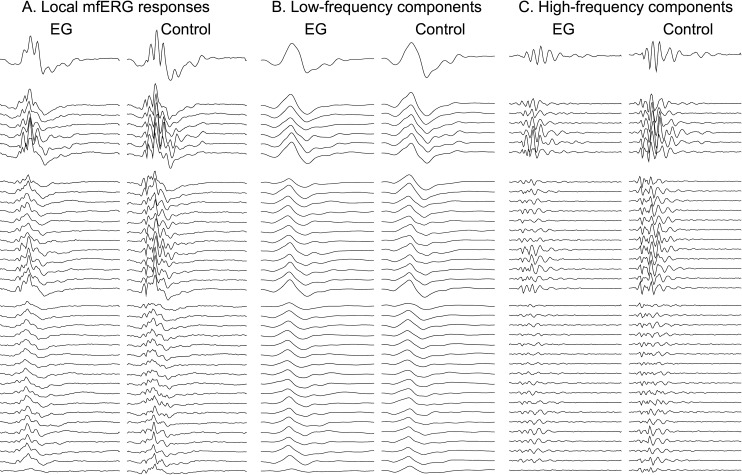
Figure 5. .
Multifocal ERG responses from the final recording session of the same individual animal shown in Figures 1 and 3. The first pair of columns (A) shows the local mfERG responses for the EG eye (left) and control eye (right); the middle pair of columns (B) contains the low-frequency components and the rightmost pair of columns (C) contains the high-frequency components filtered from the local responses. The top row of traces represents the response from the central stimulus element; the second group represents the first ring of responses around the center, and so on. These 37 response locations represent the data used to generate the spatially averaged summary parameter as described in the Methods section and shown in Figures 6 and 7.

