Figure 7. .
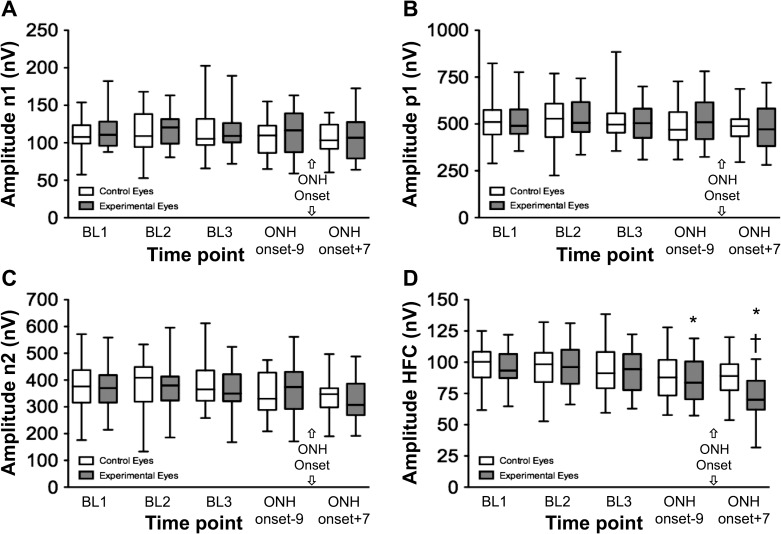
Multifocal ERG response component amplitudes versus time for the entire group. Box plots (as in Fig. 2) representing the distribution of raw values at each of the experimental recording sessions. (A) mfERG LFC features N1. (B) P1. (C) N2. (D) HFC.
*P < 0.01 versus each BL.
†P < 0.001 versus the session just prior to ONH onset (median of 9 days prior to ONH onset).

