Figure 3.
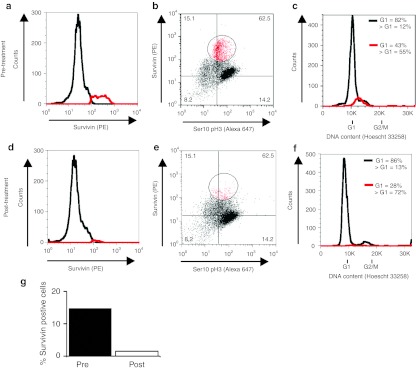
Examination of survivin expression pre- and post-ASO treatment in a trial patient. (a) Survivin positive (red) and negative (black) populations defined by FACS, before ASO administration. (b) Survivin expression plotted against ser10pH3 expression, before (pre-) ASO administration. The percentage of cells falling in each quadrant is shown. (c) Cell cycle (DNA content) distribution shown by black line, survivin positive cells (as defined in b) overlaid in red. (d-f) As a-c, but for sample obtained 48 hours following (post-) ASO administration. (g) Quantification of fraction of high survivin-expressing cells pre- and 48 hours post-treatment. ASO, antisense oligonucleotide; FACS, fluorescence-activated cell sorting; PE, phycoerythrin; ser10pH3, serine-10 phosphorylated form of histone H3.

