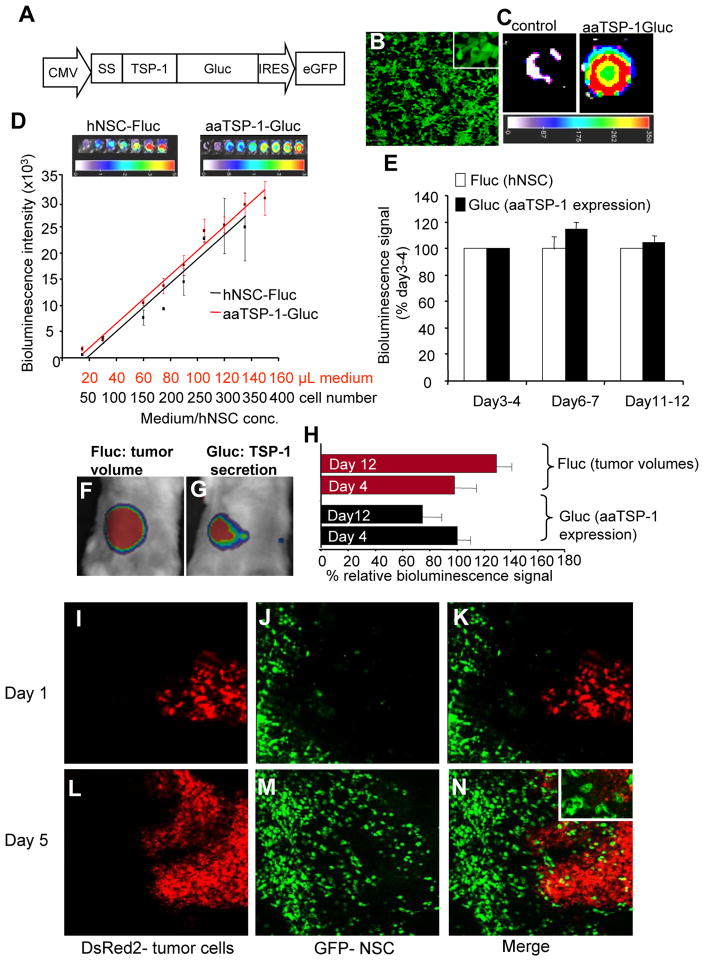
Fig. 3. Pharmacokinetics of hNSC-aaTSP1.
(A) Design of LV-aaTSP-1-Gluc construct showing the C-terminal fusion of aaTSP-1 with in vivo imaging marker, Gluc. (B) GFP fluorescence image of hNSC transduced with LV-aaTSP-1-Gluc. (C) Bioluminescence imaging of the conditioned medium from hNSC-aaTSP-1-Gluc (D) hNSC expressing aaTSP-1-Gluc were co-transduced with GFP-Fluc and cells and conditioned culture medium were imaged for Fluc and Gluc activity respectively. Correlation between the different concentrations of cells-Fluc activity and medium-Gluc activity within the ranges tested are plotted. (E) hNSC expressing aaTSP-1-Gluc and GFP-Fluc were mixed with Gli36-EGFRvIII-DsRed2 glioma cells and implanted subcutaneously in nude mice and imaged sequentially for Fluc and Gluc activity. Plot showing bioluminescence signal (Fluc and Gluc) intensity of mice imaged for a period of 12 days. (F–J) Simultaneous dual bioluminescence imaging and intravital microscopy on mice implanted with hNSC-aa-TSP-1-Gluc at 2 mm distance from the established Gli36-EGFRvIII-FD tumor site. Representative images of mice (F and G) and plot (H) showing the changes in tumor volumes (Fluc intensity) and aaTSP-1 secretion (Rluc intensity) overtime. (I–N) Intravital fluorescent images showing the homing of hNSC (GFP expression) to tumor cells (DsRed2 expression). Magnification I-N (10×); inset N (20×).

