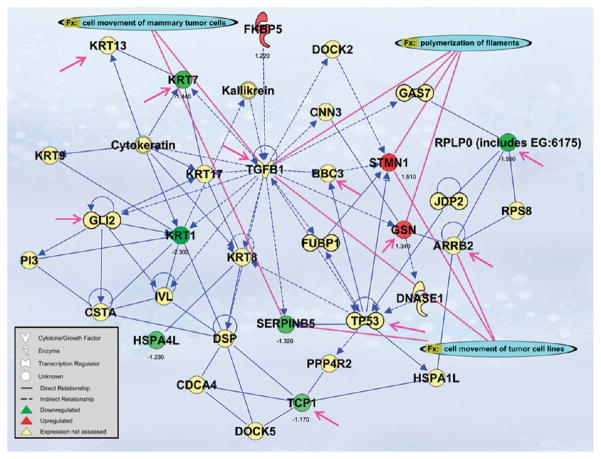
Figure 5.
Network analysis of differentially expressed proteins. A network is a graphical representation of the molecular relationships between molecules. Molecules are represented as nodes, and the biological relationship between two nodes is represented as an edge (line). All edges are supported by at least one reference from the literature, from a textbook, or from canonical information stored in the Ingenuity Pathways Knowledge Base. Human, mouse, and rat orthologs of a gene are stored as separate objects in the Ingenuity Pathways Knowledge Base, but are represented as a single node in the network. The node color indicates the directional change in protein expression of up- (red) or down- (green) and fold change (SHMEC → THMEC 40 d) in protein abundance is displayed below each molecule. Yellow nodes were added in by IPA to build the network and protein expression was not assessed. Nodes are displayed using various shapes that represent the functional class of the gene product. Edges are displayed as solid (direct) or dashed (indirect) to indicate the nature of the relationship. Functional analysis of a network identified the biological functions that were significant (p < 0.05) to the molecules in the network. The network molecules associated with biological functions in Ingenuity’s Knowledge Base were considered for the analysis. Right-tailed Fisher’s exact test was used to calculate a p-value determining the probability that each biological function and/or disease assigned to that network is due to chance alone. The biological functions cell movement of tumor cells (p = 9.24 × 10⁻⁴), cell movement of mammary tumor cells (p = 2.49 × 10⁻⁴), and polymerization of filaments (p = 3.97 × 10⁻⁶) are connected to the respective molecules with pink lines. Molecules associated with the biological process of a malignant tumor (p = 1.93 × 10⁻³) phenotype are indicated with pink arrows.

