
Table 1.
Cell viability data of ethyl acetamide side chain novologues.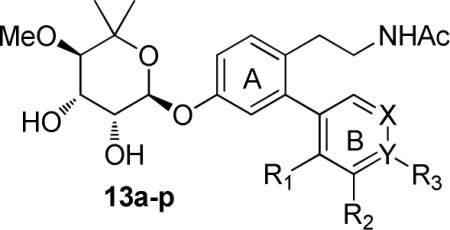
| Entry | R1 | R2 | R3 | X | Y | % of cell viabilitya |
|---|---|---|---|---|---|---|
| 2 | - | - | - | - | - | 86% ± 2 |
| 13a | H | H | H | C | C | 76%±11# |
| 13b | H | F | H | C | C | 95%±14# |
| 13c | H | H | F | C | C | 75%±27# |
| 13d | Cl | H | H | C | C | 71%±21#,* |
| 13e | H | Cl | H | C | C | 90%±23# |
| 13f | H | CF3 | H | C | C | 83%±16# |
| 13g | H | H | CF3 | C | C | 74%±19#,* |
| 13h | SMe | H | H | C | C | 83%±4O# |
| 13i | OMe | H | H | C | C | 92%±10# |
| 13j | H | OMe | H | C | C | 78%±34# |
| 13k | H | Me | H | C | C | 82%±30# |
| 13l | H | CH2-N-morpholine | H | C | C | 83%±26# |
| 13m | H | H | OH | C | C | 67%±10* |
| 13n | H | -OCH2O- | C | C | 83%±18# | |
| 13o | H | H | H | N | C | 61%±7* |
| 13p | H | H | H | C | N | 81%±12# |
a
In the presence of 1 μM of each novologue + 20 mM excess glucose. Viability in the presence of 20mM excess glucose + DMSO was 54% ± 2.
#
p<0.05 versus glucose + DMSO;
*
p<0.05 versus glucose + compound 2 (n=6–24) per novologue.