Figure 2.
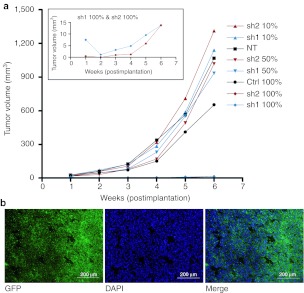
Mouse tumor growth kinetics and marker gene expression. (a) Tumor growth kinetics were measured over 6 weeks follow-up. U118MG glioma cells were transduced with lentiviral vectors encoding small hairpin RNAs (shRNAs) against Src kinase and luciferase as a control. Different proportions of transduced cells were implanted subcutaneously on flanks of nude mice and tumor growth was measured weekly in different treatment groups. The insert shows tumor growth of sh1 100% and sh2 100% groups over the same study period with a more detailed scale of y axis. P < 0.05 Ctrl versus sh1/sh2 100%. (b) Maintenance of stable transduction throughout the experiment was confirmed by green fluorescent protein (GFP) marker gene expression in frozen tumor sections. Representative sections are from a tumor formed by control virus transduced cells. 100× magnification, scale = 200 μm. Ctrl, transduced with a control vector expressing shRNA against luciferase; NT, nontransduced; sh1, shRNA sequence 1 against Src; sh2, shRNA sequence 2 against Src; shRNA, small hairpin RNA.

