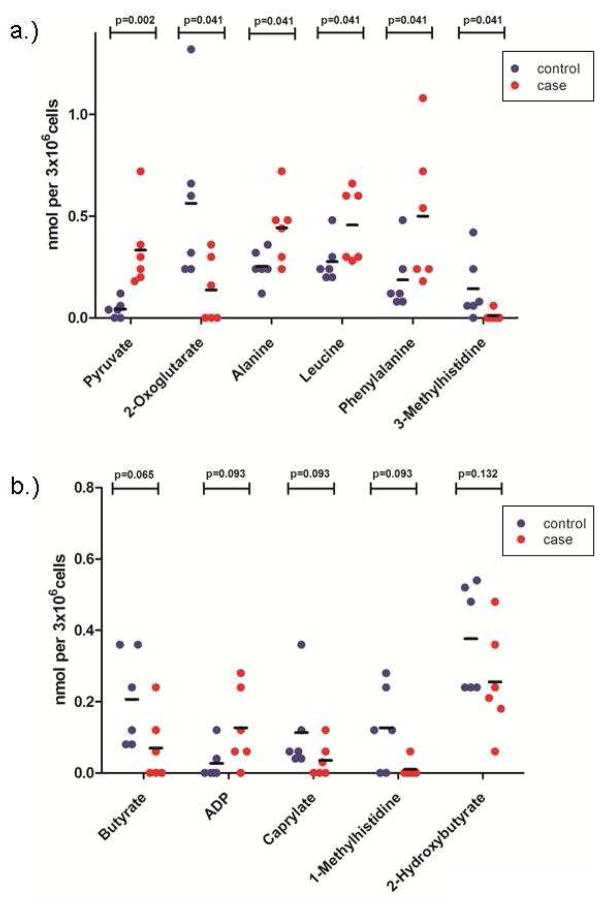
Figure 2.
Nonparametric testing of PBSC metabolites. (A) Metabolites significantly altered in PBSC samples from cases (red) compared with controls (blue) are shown (MWU p<0.05; n=6 each). (B) Metabolites with possible alterations in cases (red) compared to controls (blue) (MWU 0.05 < p <0.15; n=6 each).

