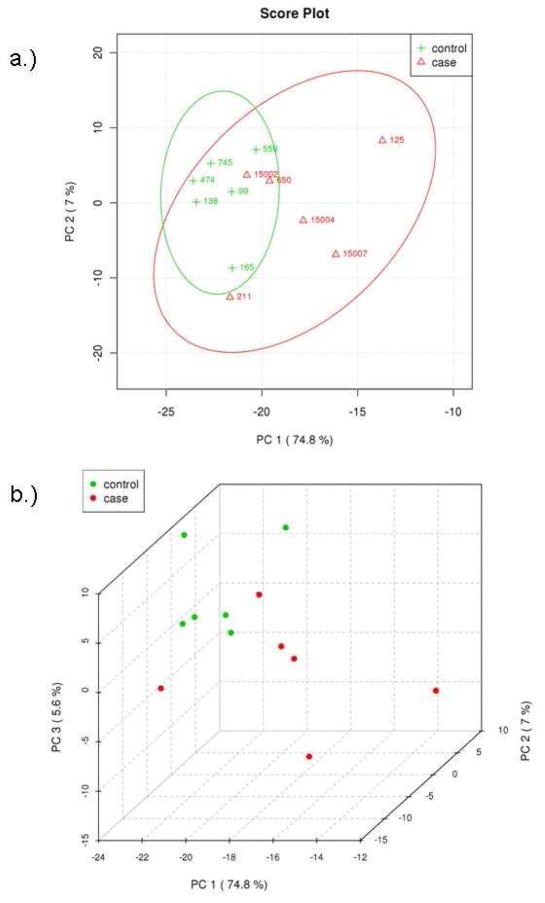
Figure 3.
Principal components analysis of metabolic profile differences between patient groups. (A) PCA scores of components 1 and 2 of calculated hydrophilic metabolite levels from control PBSC samples (green) and t-MDS patient PBSC (red). (B) PCA scores of components 1, 2, and 3 for the control PBSC (green) and t-MDS/AML PBSC (red). The explained variances are shown in parentheses.

