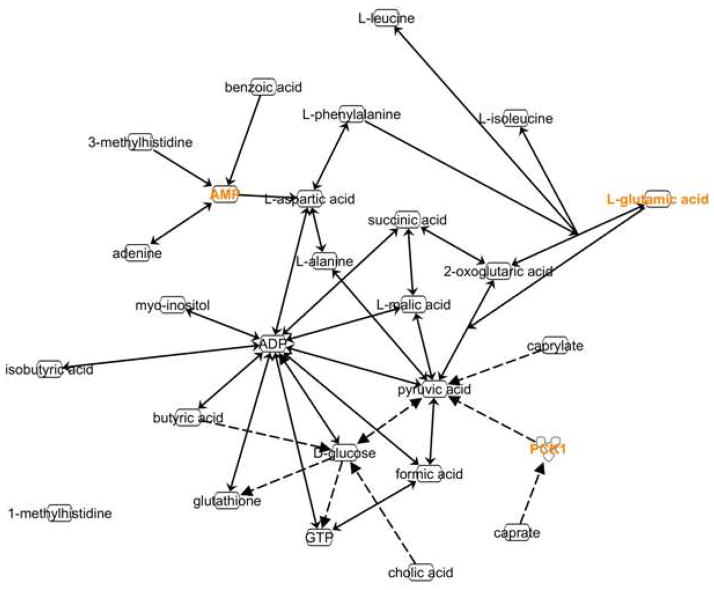
Figure 6.
Schematic representation of the interaction between significantly relevant hydrophilic metabolites. Ingenuity Pathway software was used to search connections between selected metabolites. Direct biochemical reactions are indicated by solid arrows; indirect effects are represented by dashed arrows.

