Figure 3.
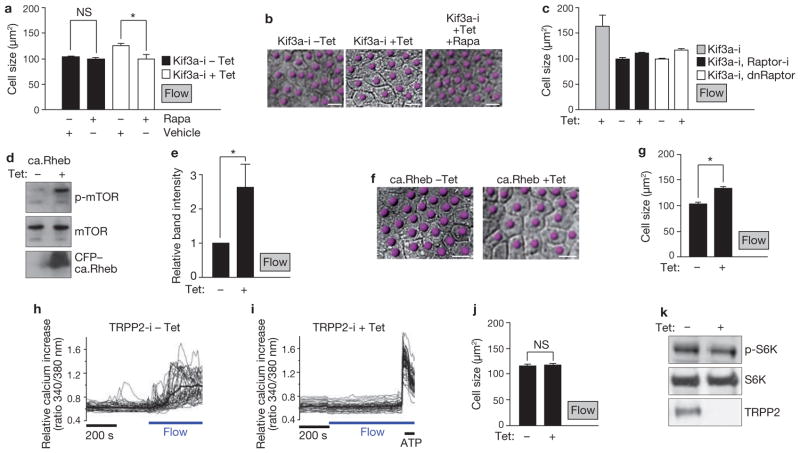
Flow-induced cell-size regulation is mTOR dependent and ablation of flow-induced calcium transients has no effect on cell size. (a) Size of Kif3a-i cells, in absence or presence of tetracycline and treated as indicated, under flow conditions. Uninduced Kif3a-i cells (filled bars), n = 6; with rapamycin, n = 6; P = 0.3. Kif3a-i knockdown cells (unfilled bars), n = 10; with rapamycin, n = 9. Asterisk indicates P < 0.001. (b) DIC microscopy images of Kif3a-i cells treated as indicated and grown under flow conditions for 5 days. Cells are indicated by dots. (c) Size of the indicated Kif3a-i cells, in absence or presence of tetracycline, under flow conditions. Raptor-i, Kif3a-i cells with tetracycline-inducible expression of Raptor shRNA; dnRaptor; cells with tetracycline-inducible expression of a dominant-negative Raptor mutant. Kif3a-i cells with tetracycline, n = 21. Kif3a-i, Raptor-i cells, n = 6. Kif3a-i, dnRaptor cells, n = 5. (d) Western blot to assess phosphorylation of mTOR after induction of a gain of function Rheb mutant in cells under flow conditions. (e) Intensity of p-mTOR bands, relative to intensity of mTOR bands, from five independent experiments performed as in d. Asterisk indicates P < 0.05. (f) Representative DIC microscopy images of MDCK cells expressing the tetracycline-inducible Rheb mutant, grown under flow conditions for 5 days. Cells are indicated by dots. (g) Size of MDCK cells expressing the tetracycline-inducible Rheb mutant, grown under flow conditions for 5 days. n = 14 (cells without tetracycline) and n = 16. Asterisk indicates P < 0.0001. (h, i) Intracellular calcium measurements of MDCK cells with tetracycline-inducible expression of TRPP2 shRNA (TRPP2-i cells), without tetracycline induction (h), and with tetracycline induction (i). Thin traces, individual cells; bold trace, mean calcium value. ATP stimulation demonstrates cell viability. Scale bar indicates length of 200 s on x axis. Flow indicates onset of flow. (j) Size of TRPP2-i cells under flow conditions. Without tetracycline; n = 7 and with; n = 10; P = 0.8. (k) Western blots of lysates from TRPP2-i cells under flow conditions and treated with tetracycline as indicated. Data in a, c, e, g and j are means ± s.e.m. Scale bars, 10 μm. Uncropped images of blots are shown in Supplementary Information, Fig. S6.

