
Figure 3.
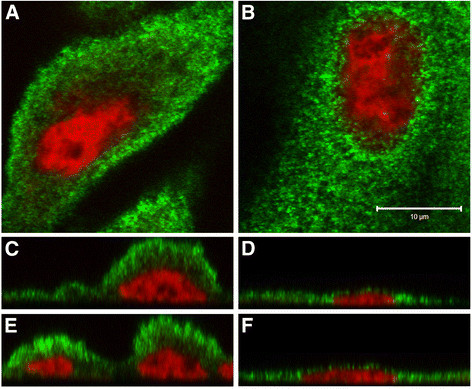
Immunofluorescent localization of ZIP8 in HPT cells. The two patterns of localization are shown. The first is a concentration of ZIP8 at the apical face (A, C, E) which is the dominant localization observed. The second is a concentration of ZIP8 in the paranuclear region (B, D, F). All HPT cells showed ZIP8 extending throughout the cytoplasm in a punctate pattern consistent with the endoplasmic reticulum. ZIP8 staining is shown in green while the nuclear dye To-PRO-3 iodide is shown in red. Single Z-series slices are shown in A and B while orthogonal views in the X- and Y-planes are shown in C, D and E, F respectively. Bar = 10 μm and represents the scale for both A and B.