
Figure 6.
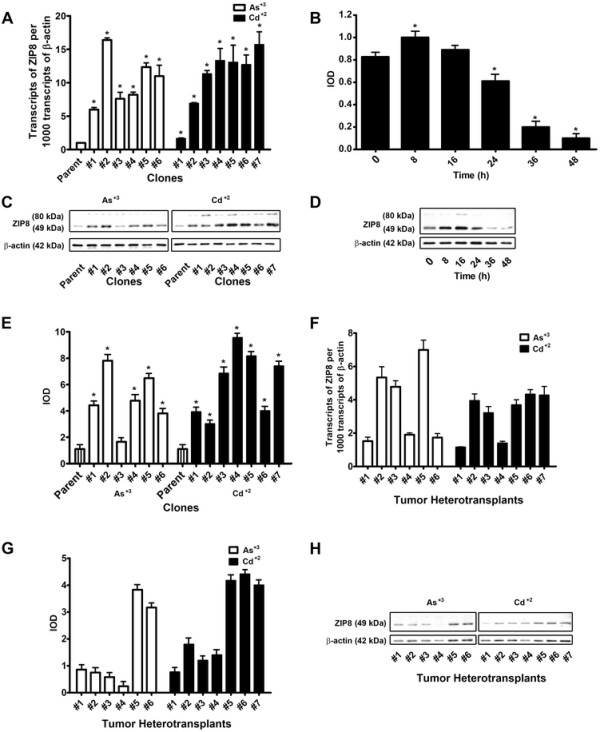
Expression of ZIP8 in UROtsa cell lines transformed by As+3and Cd+2and their corresponding tumor heterotransplants.A. Real-time PCR analysis of ZIP8 mRNA in As+3 and Cd+2 transformed cell lines. The analysis was done in triplicates and the results are expressed as mean transcript number per 1000 transcripts of β-actin. * Statistically significant compared to parental UROtsa cells. B and D. Effect of feeding on the expression level of ZIP8 protein in UROtsa parent cells. B. Mean (+) IOD values are for lower bands representing the 49 kDa form of ZIP8. C and E. Western analysis of ZIP8 protein in UROtsa cells transformed by As+3 and Cd+2. Mean (+) IOD values are for lower bands (D) representing the 49 kDa form of ZIP8. F,G and H. Expression of ZIP8 in tumor heterotransplants. F. Real-time PCR analysis of ZIP8 mRNA. G and H. Western analysis of ZIP8 protein. Mean (+) IOD values are for lower bands representing the 49 kDa form of ZIP8.