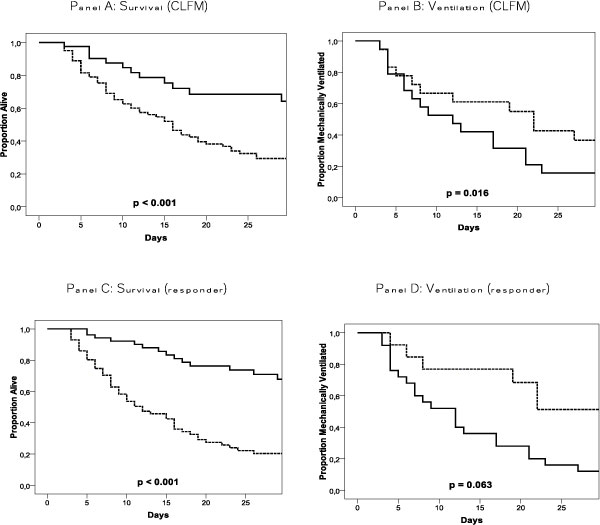
Figure 4.
Kaplan-Meier plots. Kaplan-Meier plots for cumulative survival and proportion of patients on MV. We compared CLFM and no CLFM achievement (full lines and dotted lines, respectively) in A (survival) and B (ventilation). In C (survival) and D (ventilation), responders and nonresponders were compared (full lines and dotted lines, respectively).

