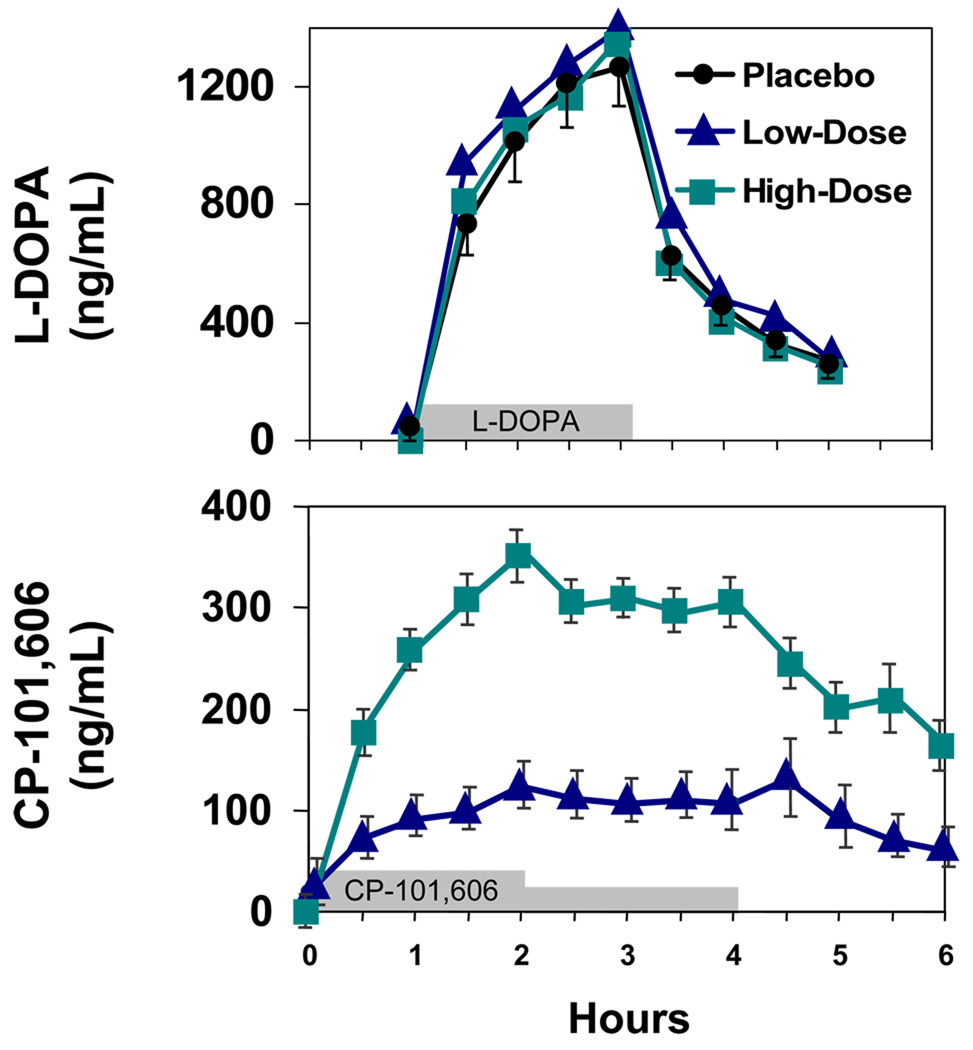
Figure 2. Time course of plasma concentrations of levodopa and CP-101,606.
Mean and standard errors for plasma levodopa concentrations (upper panel) and CP-101,606 concentrations (lower panel). For clarity, standard errors for the levodopa concentrations are shown only for the day the concomitant infusion was placebo. The time of the drug infusions are represented by the bars on the abscissa. N = 8 tp 12 subjects at each time point.

