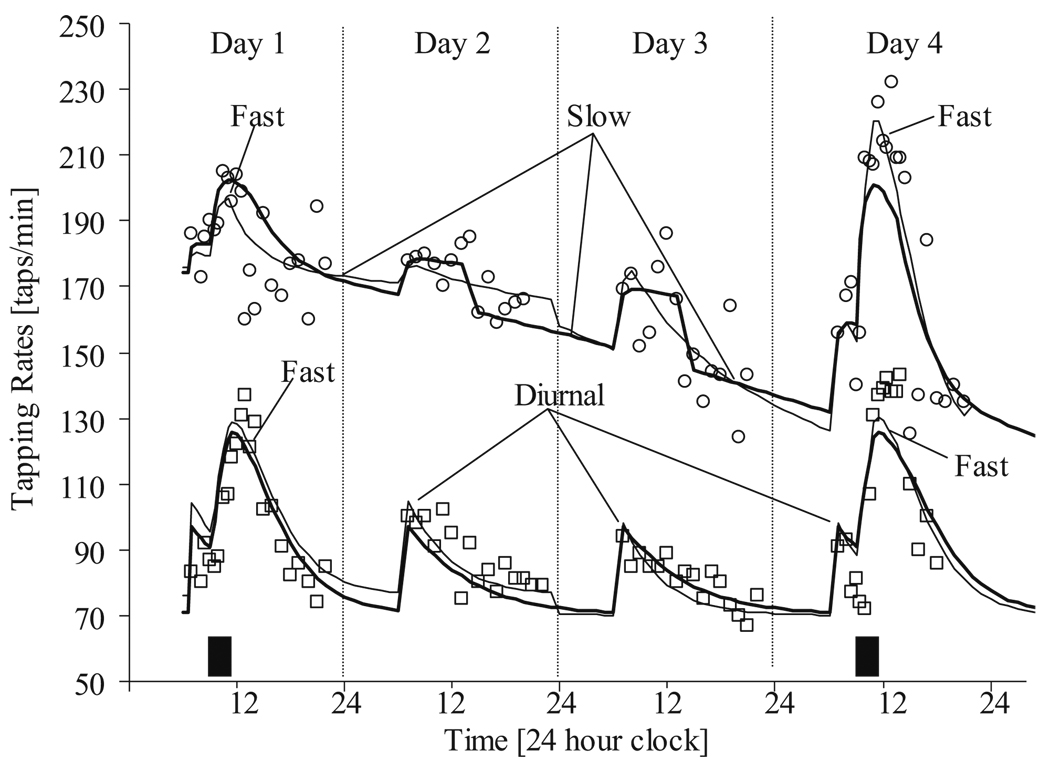
Fig. 1.
Individual fit of observed tapping rates for two illustrative patients with Parkinson’s disease (PD) using a model similar to Eq. 4. Squares are derived from a PD subject at the initiation of long-term levdoopa therapy (no previous levodopa treatment) and circles represent a PD subject who had been on long-term levodopa therapy (chronic treatment). Filled rectangles indicate the timing and duration of levodopa infusions. The thin solid line is the model prediction where no difference in the pharmacodynamic parameters before and after the drug holiday is assumed. The heavy solid line is the model prediction where different parameters are used to describe the responses before and after the drug holiday. From [5]

