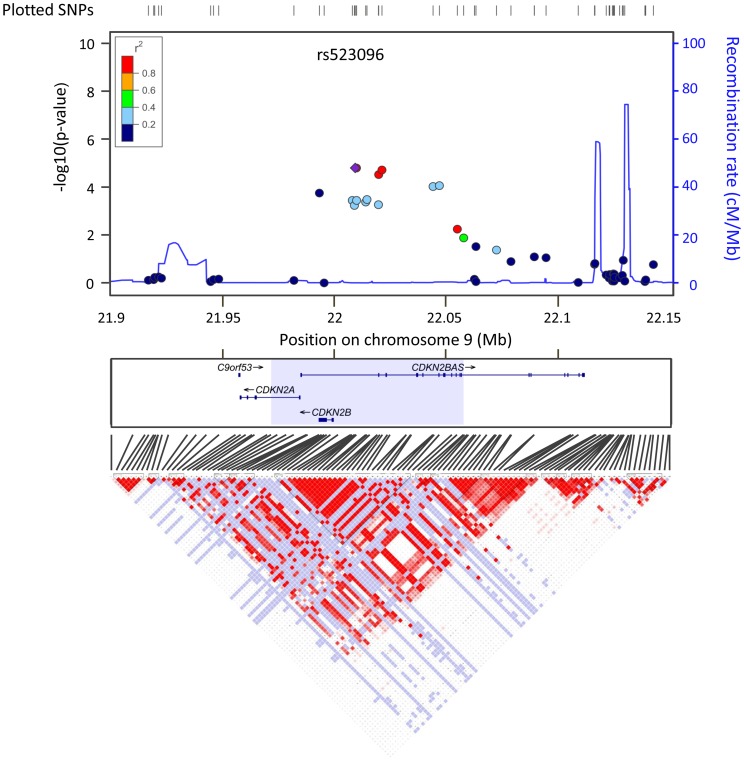
Figure 2. LD plots on 9p21 in first screening data in dense association mapping region.
Upper panel shows plots of negative common logarithm of association p-values for 9p21 locus. Each dot represents an SNP from the first screening and the colors of the dots represent the extent of linkage disequilibrium with rs523096 (purple diamond). Shaded area in the middle panel of the gene structures indicates the 87-kbp region, defined as the dense association mapping region. Lower panel shows an LD plot (D-prime) of Japanese specimens from HapMap III data.

