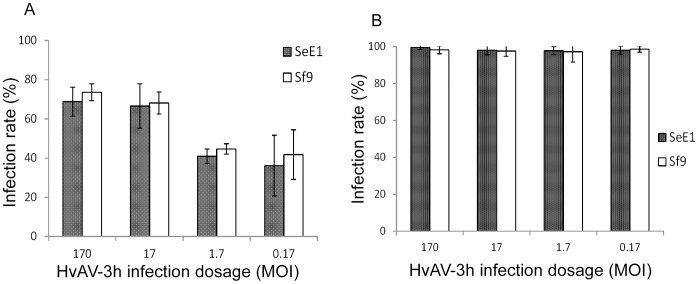
Figure 6. Dose response of SeE1 and Sf9 cells to HvAV-3h infection.
SeE1 and Sf9 cells were infected separately with different multiplicity of infection (MOI) of HvAV-3h. Infection rates were calculated from four independent random pictures taken every 12 h p.i. until 240 h p.i. A, comparison of infection rates of different HvAV-3h MOI infection at 48 h p. i. B, comparison of infection rates of different HvAV-3h MOI infection at 108 h p. i. Vertical bars denote standard deviation of four independent infection rates.

