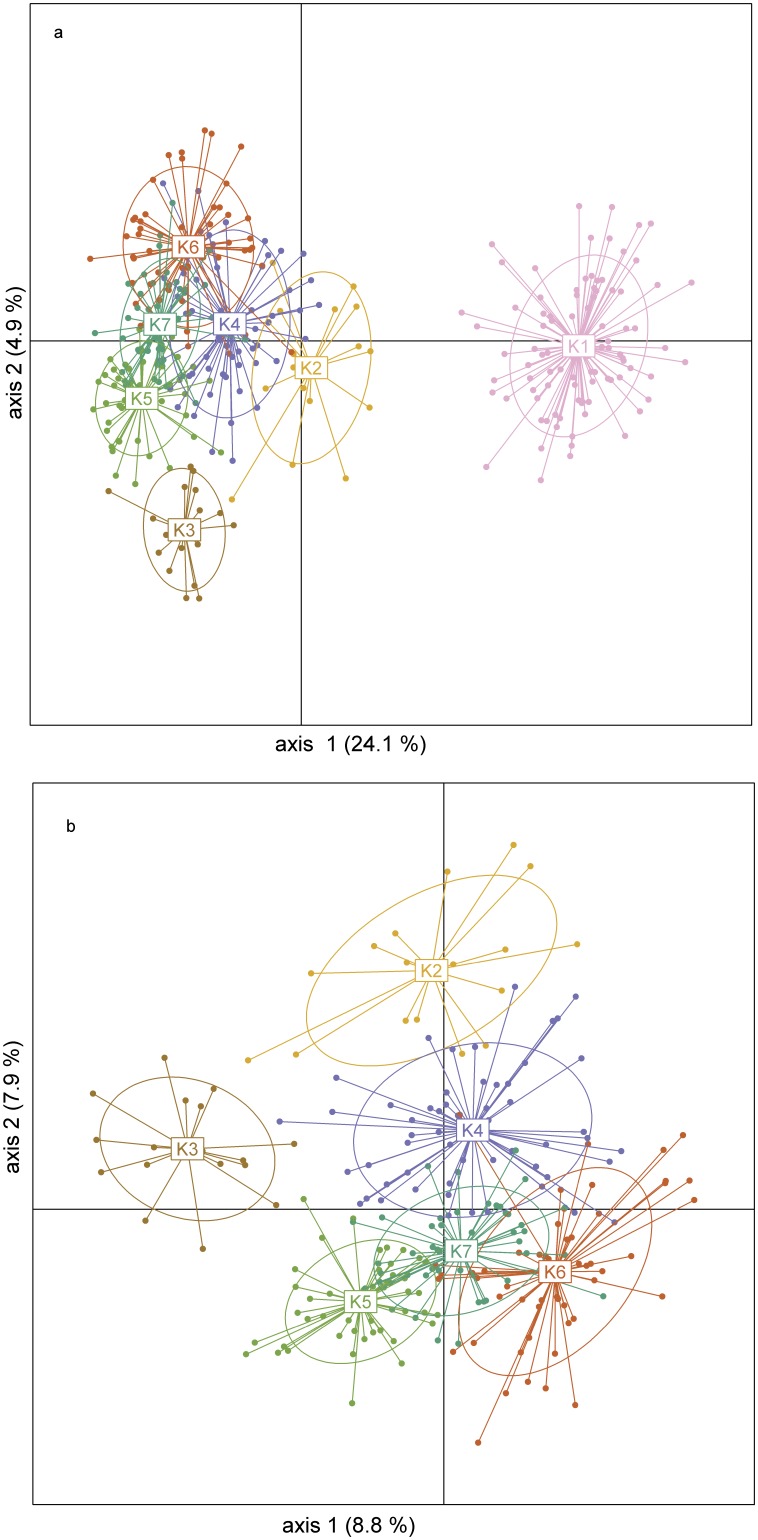
Figure 3. Principal coordinate analysis based on Jaccard similarity among AFLP multilocus phenotypes of Knautia arvensis agg.
(a) entire data set; (b) excluding the most divergent group K1 (i.e., non-relict diploids). The different colours represent the groups identified by nonhierarchical K-means clustering (same as in Fig. 2). The centroid of each group and its connection with other points are displayed as well as an ellipse reflecting the variance of the group and the covariance on the axes.

