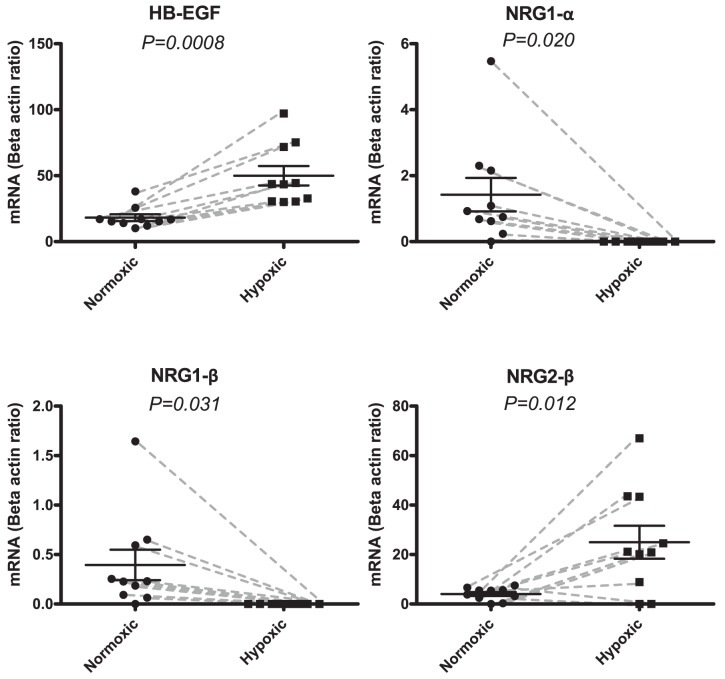
Figure 2. mRNA expressions of the ligands HB-EGF, NRG1-α, NRG1-β, and NRG2-β in the human biopsies.
Samples were obtained from a normoxic part of the heart and compared to a hypoxic part. Normoxic tissue expressions are depicted with circular points and hypoxic expression with squares. Each paired sample is connected with a grey dashed line. Data is represented with means and SEM as the ratio between the reference gene beta actin. HB-EGF shows significant up-regulation from a mean value of 18.1 (Normoxic) to 50.0 (Hypoxic) (P = 0.0008). NRG1-α shows significant down-regulation from a mean value of 1.4 (Normoxic) to 0.0 (Hypoxic) (P = 0.0204). NRG1-β shows significant down-regulation from means 0.4 (Normoxic) to 0.0 (Hypoxic) (P = 0.0308). NRG2-β shows significant up-regulation from means 4.1 (Normoxic) to 25.0 (Hypoxic) (P = 0.0120).

