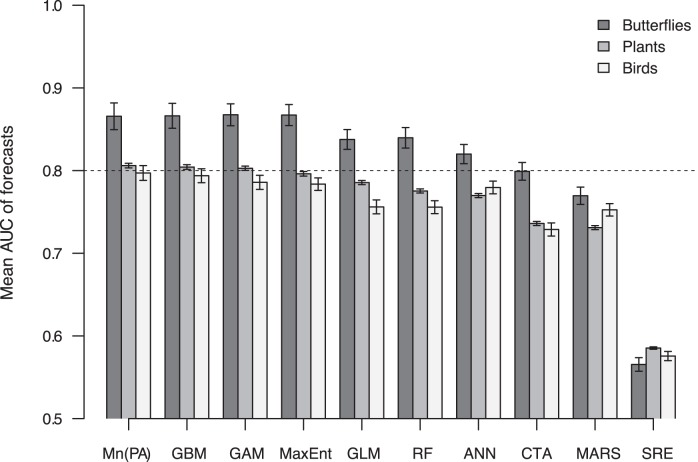
Figure 1. Accuracy of model forecasts.
The accuracy of forecasts generated by each modelling framework was measured by mean AUC and reported for each major taxonomic group. Error bars represent ±1 standard error of the mean. The dashed line indicates the rule-of-thumb for good predictions (AUC = 0.8). Abbreviations: ANN = artificial neural networks, CTA = classification tree analysis, GAM = generalised additive models, GBM = generalised boosted models, GLM = generalised linear models, MARS = Multivariate adaptive regression splines, MaxEnt = maximum entropy models, Mn(PA) = prediction mean from all presence-absence modelling frameworks, RF = random forests, SRE = surface range envelopes.

