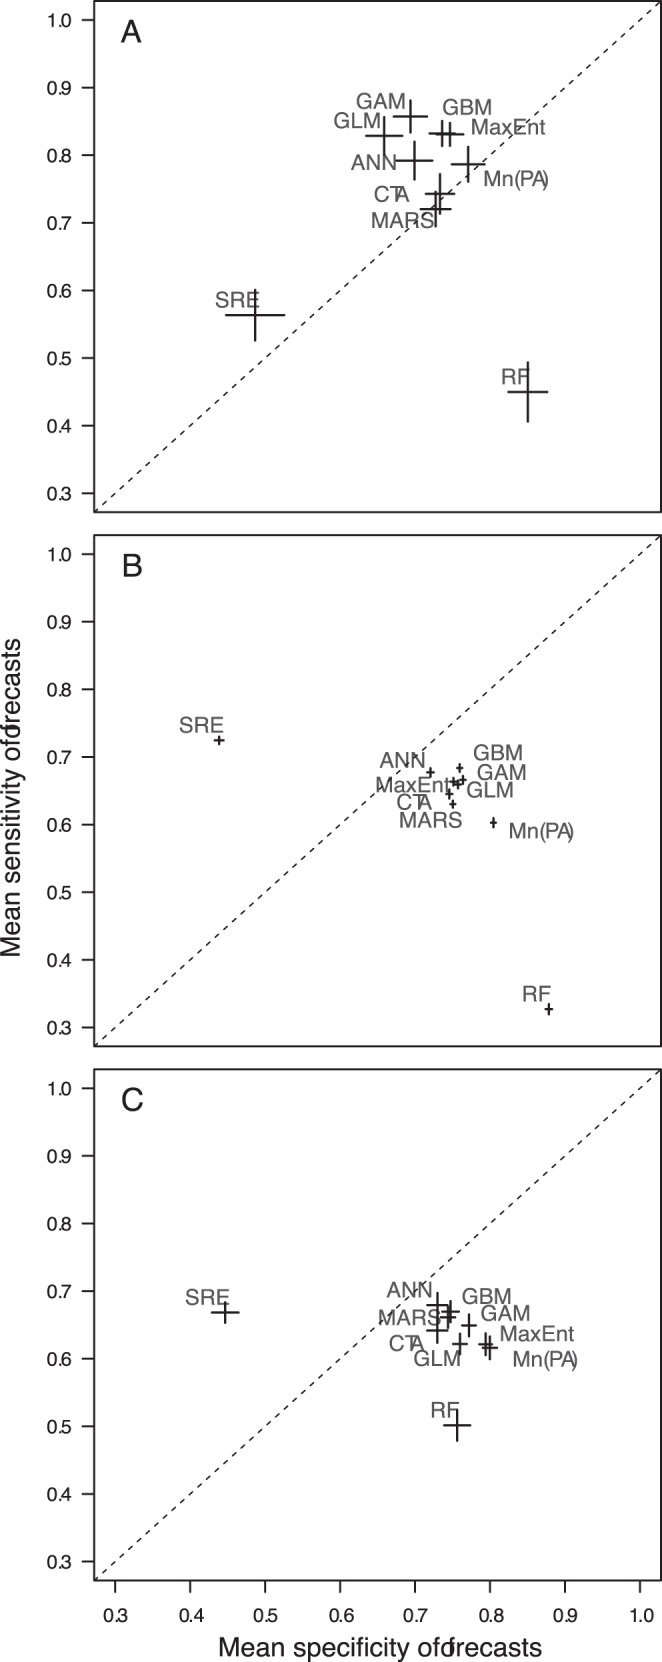
Figure 2. Mean sensitivity versus mean specificity of model forecasts.

Mean sensitivity and specificity of forecasts generated by each modelling framework for (A) butterflies, (B) plants, (C) birds. Error bars represent ±1 standard error of the mean. The dotted line indicates the condition where mean sensitivity = mean specificity.
