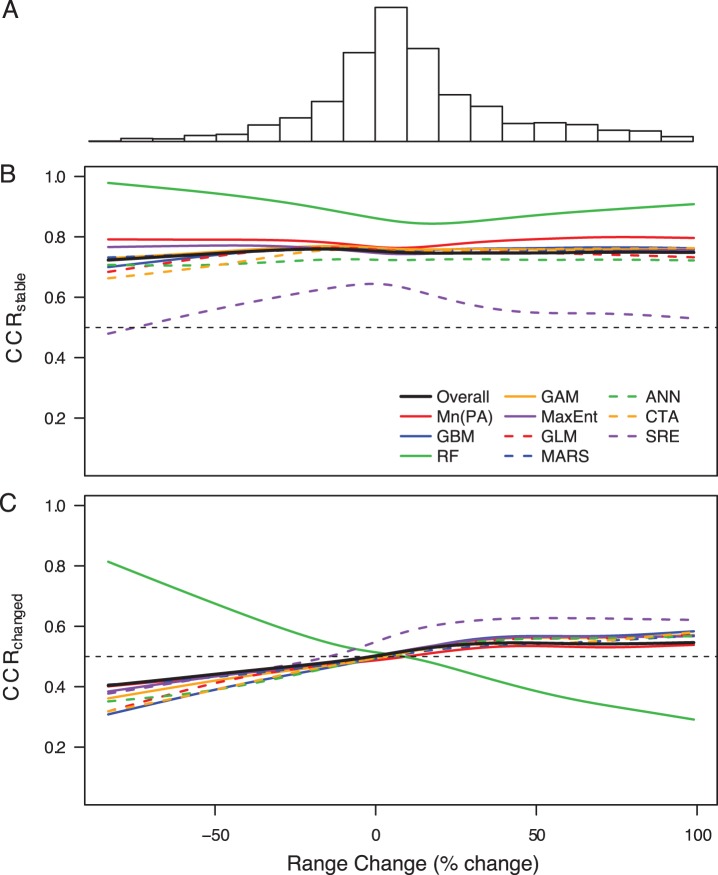
Figure 3. Accuracy of forecasted changes in species occupancy.
Accuracy of predicted changes in occupancy between t1 and t2 as a function of species’ observed proportional range change between t1 and t2: (A) histogram of the frequency of species’ proportional range change values; (B) correct classification rate across stable grid squares (i.e., those that have remained either occupied or unoccupied between time periods; CCRstable) as a function of observed proportional range change, overall and for each modelling technique; (C) correct classification rate across changed grid squares (i.e., those that have changed occupancy status between time periods; CCRchanged) as a function of observed proportional range change, overall and for each modelling technique. Functions were fitted using generalised additive models (GAM; using a cubic spline smoother with 4 degrees of freedom). This analysis was limited to species experiencing a proportional change between −100% and +100% (i.e., 85% of all species), due to the very high influence of the few species whose range more than doubled. The dashed line in panels (B) and (C) represents the value of CCR expected from a random guess (i.e., CCR = 0.5).

