
Figure 2. An example genotype-to-phenotype map and the calculation of its genetic complexity.
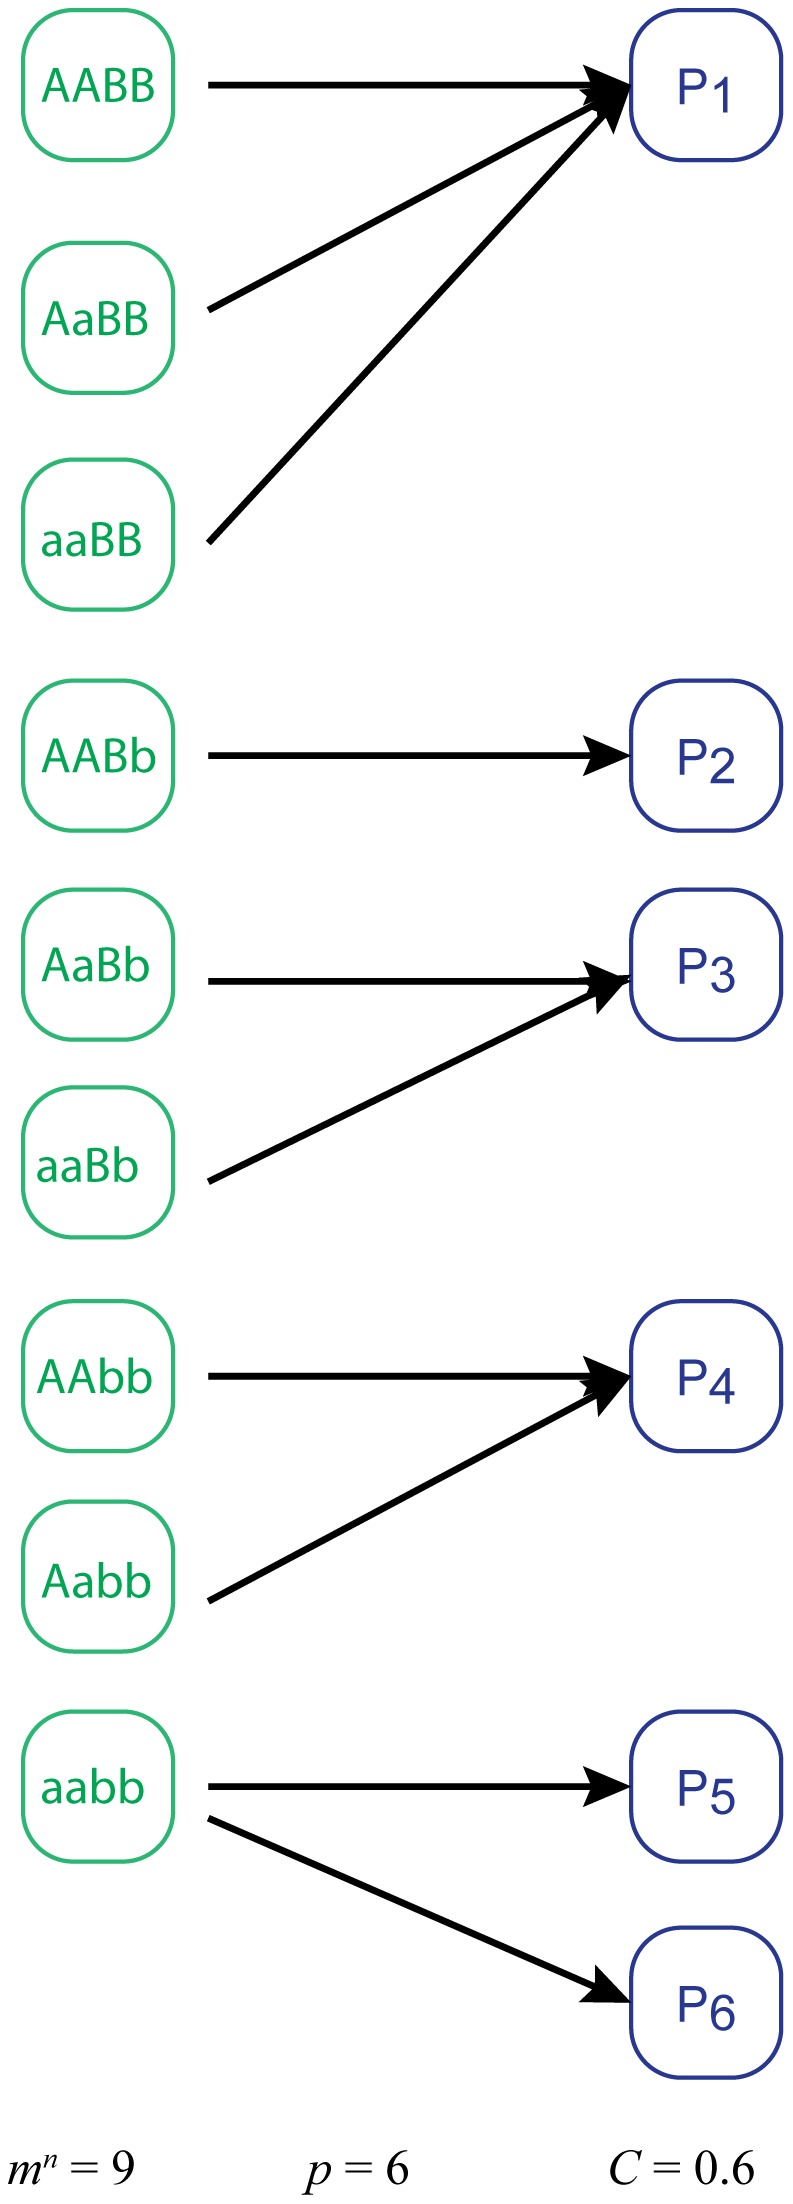
The mapping describes a diploid organism with a phenotype that has two relevant loci (‘A’ and ‘B’), each with two alleles (differentiated by uppercase and lowercase letters).