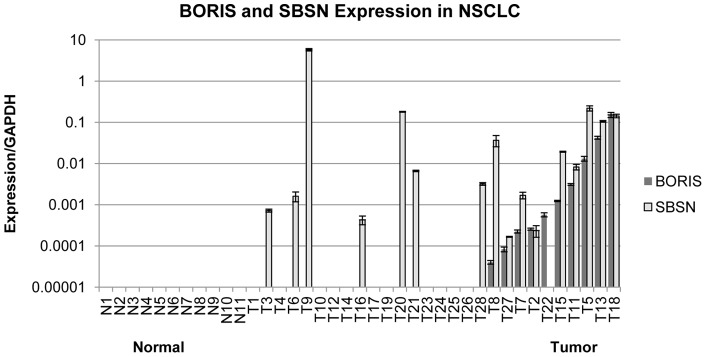
Figure 1. BORIS and SBSN expression in NSCLC clinical samples.
BORIS and SBSN expression in 11 samples from healthy individuals (N, left) and 28 samples from NSCLC patients (T, right). Expression was quantified relative to GAPDH. SBSN and BORIS co-express with p-value = 0.0004 (by Fisher exact test). Clinical samples were ranked by BORIS expression level.

