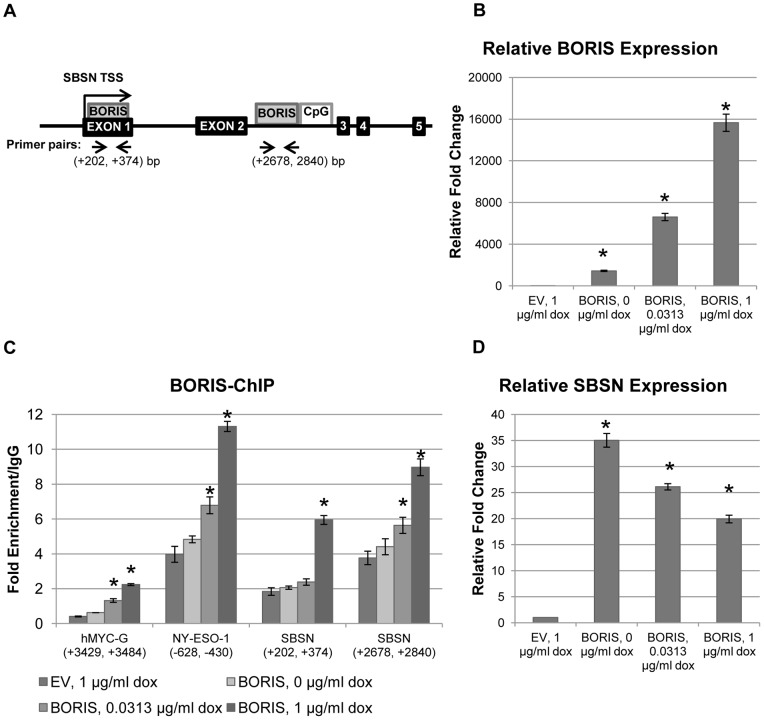
Figure 2. SBSN is a target of dose-dependent BORIS transcriptional regulation.
(A) Schematic structure of the SBSN gene. The relative positions of exons, CpG islands, and CTCF/BORIS (BORIS) binding sites are shown in black, white and grey, respectively. Transcription start sites (TSS) at the +1 position are indicated by arrows. TSS-relative positions of primers used in qRT-PCR reactions from ChIP-purified DNA are indicated by arrow heads. (B) Relative BORIS mRNA level in the H358 cell line after transient transfection of BORIS. BORIS expression was induced by indicated concentrations of doxycycline (dox) 24 hours after transfection with control empty vector (EV) or with BORIS expressing vector. Expression was quantified relative to GAPDH with the control referred as 1 (*, p-value <0.00005 (t test)). (C) BORIS binding at two prospective BORIS binding sites at SBSN, positive control NY-ESO-1, and at negative control hMYC-G non-binding site [24], shown in (A), as analyzed by qRT-PCR from ChIP DNA. Fold enrichment is relative to IgG binding (*, p-value <0.04; here and further below unlabeled bars are p-value >0.05). (D) Expression of SBSN after transient transfection of BORIS. cDNA from the experiment in (B) was used for qRT-PCR. SBSN expression was quantified relative to GAPDH expression and normalized to control referred as 1 (*, p-value <0.00006). Mean value ± SEM for 3 replicates is shown for all experiments.

