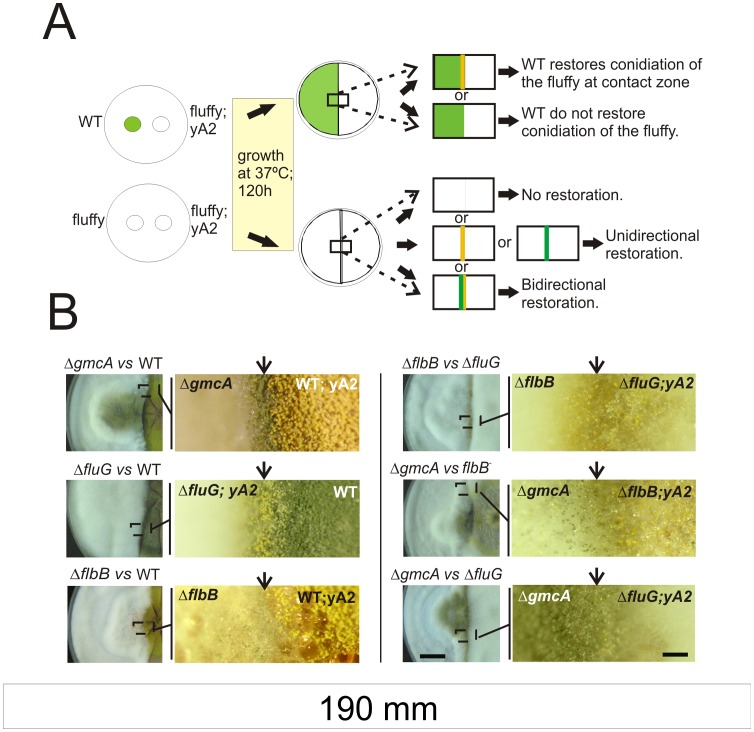
Figure 5. Extracellular complementation assays for conidiation induction.
A) Schematic representation of the procedure followed in extracellular complementation experiments and the interpretation of possible results. B) Contact zones and magnifications of selected regions are shown for different combinations of strains. On the left, ΔgmcA (BD429; green spores; top), ΔfluG (TTA127.4; yellow spores; middle) or ΔflbB (BD143; green spores; bottom) null mutants are assayed against the wild type (yellow, MAD782, or green, FGSC26, colored) strains. On the right, contact regions and respective magnifications of selected regions are shown between ΔfluG (TTA127.4; yellow) and ΔflbB (BD143; green; top), ΔgmcA (BD429; green) and flbB- (BD70; yellow; middle) or ΔgmcA (BD429; green) and ΔfluG (TTA127.4; yellow; bottom) strains. Images were taken 120 hours after inoculation. Scale bars represent 2 cm (left) and 0.15 cm (right), respectively.

