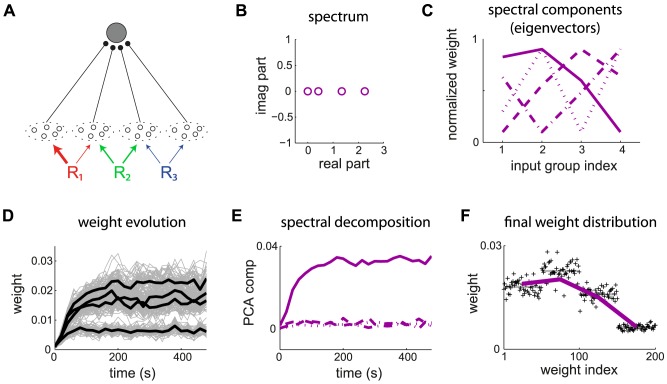
Figure 5. Principal component analysis for mixed correlation sources.
(A) The postsynaptic neuron is excited by  pools of 50 inputs each with the global input correlation matrix
  in (13). The thickness of the colored arrows represent the correlation strengths from each reference to each input pool. The input synapses are modified by log-STDP with
  . The simulation parameters are given in Table 1. (B) Spectrum and (C) eigenvectors of
  . The eigenvalues sorted from the largest to the smallest one correspond to the solid, dashed, dashed-dotted and dotted curves, respectively. (D) Evolution of the weights (gray traces) and the means over each pool (thick black curves) over 500 s. (E) Evolution of the weights
  in the basis of spectral components (eigenvectors in C). (F) Weight structure at the end of the learning epoch. Each weight is averaged over the last 100 s. The purple curve represents the dominant spectral component (solid line in C).

