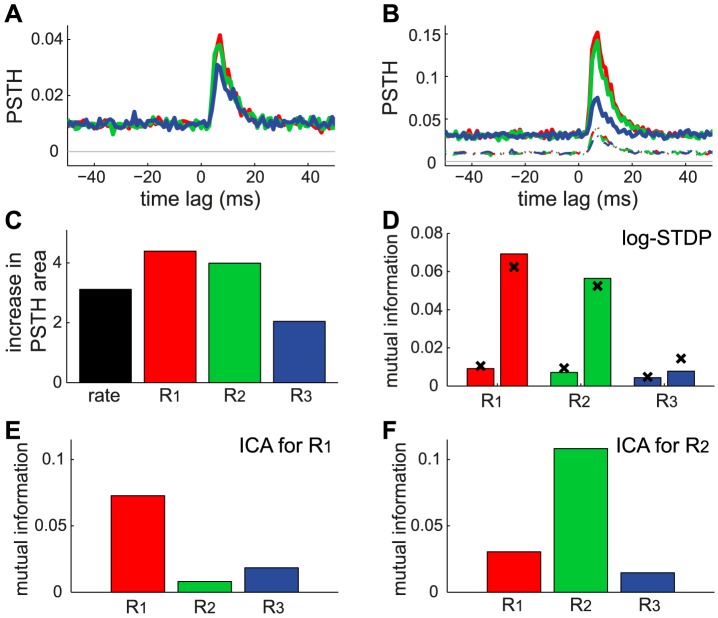
Figure 6. Transmission of the correlated activity after learning by STDP.
The results are averaged over 10 neurons and 100 s with the same configuration as in Fig. 5. Comparison of the PSTHs of the response to each correlated event of  (A) before and (B) after learning for
  (red),
  (green) and
  (blue). Note the change of scale for the y-axis; the curves in A are reproduced in B in dashed line. (C) Ratio of the learning-related increase of mean firing rate (black) and PSTHs in B with respect to A (same colors). For each PSTH, only the area above its baseline is taken into account. (D) Mutual information
  between a correlated event and the firing of two spikes, as defined in (14). For each reference, the left (right) bar indicates
  before (after) learning. The crosses correspond to the theoretical prediction using (16) as explained in the text. (E) Example of neuron selective to
  with weight means for each pool set by hand to
  ;
;  and
and  . The bars correspond to the simulated
  similar to D. (F) Same as E with a neuron selective to
  and
and  ;
;  and
and  .
.

