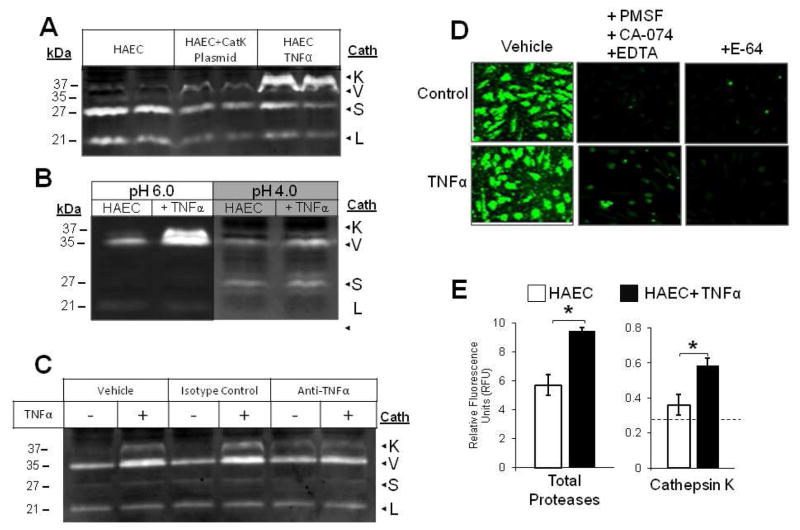
Fig 2.
TNFα turns on cathepsin K activity in endothelial cells (A) ECs were transfected with cathepsin K gene on pCMVSport6 to drive overexpression. Cell lysates collected from HAECs treated with and without 10ng/mL TNFα, and ECs transfected with cathepsin K plasmid were lysed, prepared, and loaded for cathepsin zymography. (B) Cell lysates collected from HAECs treated with and without 10 ng/mL TNFα were incubated in assay buffer of pH 4 or 6 to observe the disappearance of the 37 kDa cathepsin K band at pH 4. The cathepsin K bands and TNFα stimulated bands appeared at the same molecular weight in the zymogram. (C) HAECs were stimulated with 10ng/mL TNFα combined with either 10μg/mL anti-TNFα antibody, or isotype controls. Cell lysates were collected and cathepsin activity was assessed via gelatin zymography. (D) For in situ zymography, endothelial cells treated with or without 10 ng/mL TNFα were incubated in zymography assay buffer containing 1mM 5-NSA and 0.5 mM Z-GPR-MβNA only or 10mM EDTA, 2mM DTT, 1mM PMSF, and 10μM CA-074 to select for cathepsin K activity, endothelial cells were also treated with 5μM E-64 to block all cathepsin activity. (E) Fluorescent images of cultures were taken and mean fluorescence intensity for total fluorescent signal and cathepsin K specific cathepsin activity was quantified

