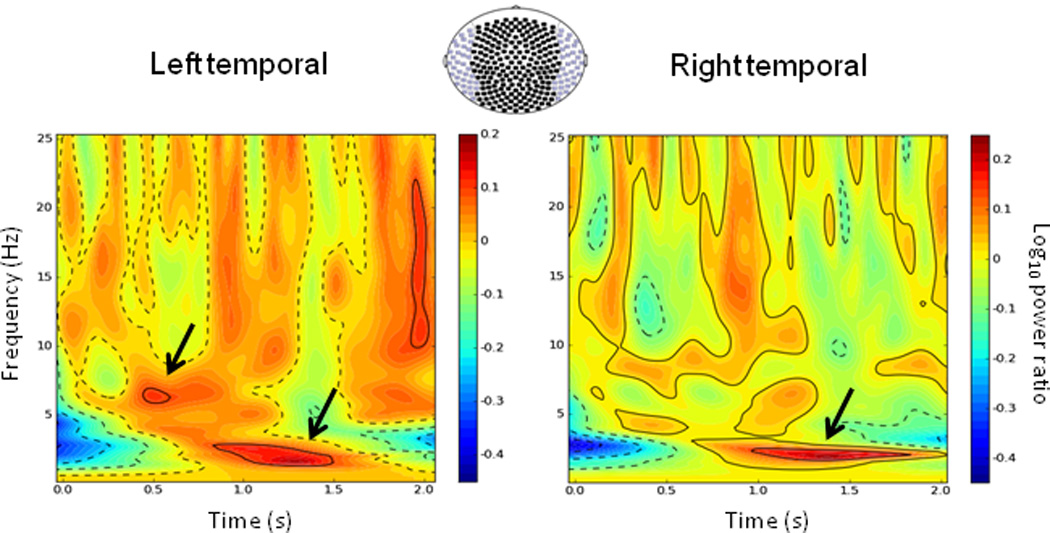
Figure 3.

Induced spectral differences in navigation-related oscillatory activity between threat and safe conditions. Grand-averaged (N = 25) time-frequency plots of differential navigation-related activity (threat - safe) for the hidden platform run. Data are unsmoothed and normalized to a 1-s baseline period (not shown). The first 2 seconds of the trial is averaged for sensors (axial gradiometers) overlying left and right temporal cortices separately (purple-colored in the sensor array). Arrows highlight two peak spectral differences in the theta band between threat and safe conditions. Time is relative to trial onset.
