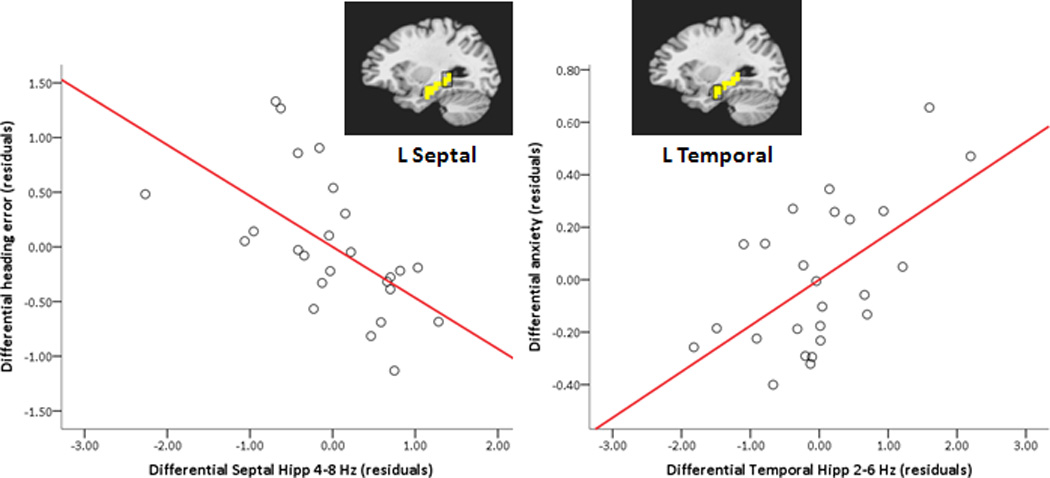
Figure 4.

Hippocampal region-of-interest (ROI) theta predicts navigation performance and anxiety level. Partial regression plots (with least square lines) show relationships between differential (threat – safe) left hippocampal ROI high theta (4–8 Hz) and differential heading error (left), and between differential left hippocampal ROI low theta (2–6 Hz) and differential anxiety in the hidden platform condition (right). A mask of the left hippocampus (in yellow) is overlayed on a standardized brain, highlighting septal and temporal thirds of the hippocampus from which data were extracted for regression analyses. Note that smaller differential heading errors reflect better performance during threat relative to safe conditions. Hipp = hippocampus; L = left.
