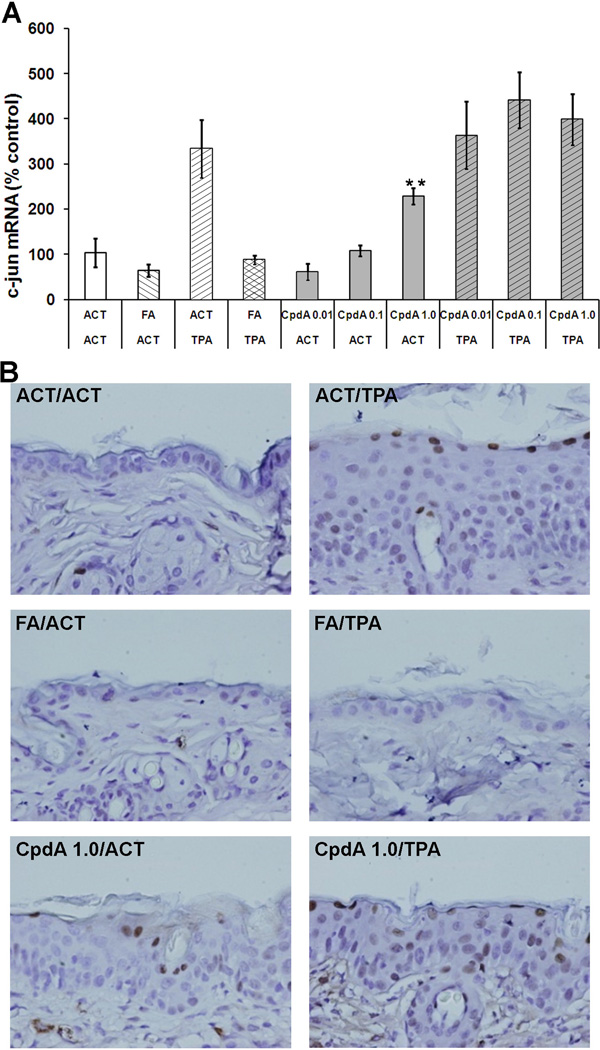
Figure 3. The effect of CpdA on c-jun mRNA and protein level.
A - the effect of CpdA and FA applied alone or together with TPA on c-jun mRNA level was measured using RT-PCR analysis. Presented results represent the average (±S.D.) from at least three independent measurements, P value <0.01(**) vs. acetone (ACT) group. B - Representative microphotographs (×400) showing c-jun protein levels by immunohistochemistry.

