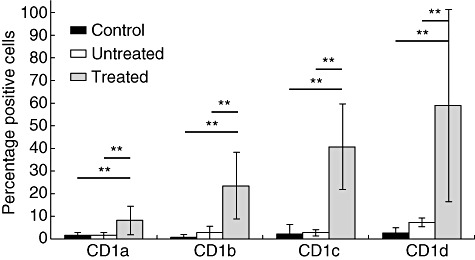
Fig. 3.

CD1 expression in monocytes from multiple sclerosis (MS) patients. CD1 molecule (CD1a, CD1b, CD1c and CD1d) phenotypes in monocytes from MS patients treated (n = 4) or untreated (n = 4) and control individuals (n = 6) were analysed by flow cytometry (standard deviation, Mann–Whitney U-test standard deviation, Mann–Whitney U-test: **P-value < 0·01%).
