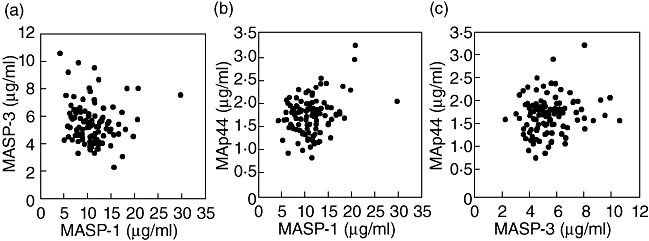
Fig. 7.

Comparison of the serum levels of the three proteins encoded by the MASP1 gene. The three graphs compare the levels of: (a) mannan-binding lectin (MBL)-associated serine protease-1 (MASP-1) (x-axis) and MASP-3 (y-axis), (b) MASP-1 (x-axis) and MAp44 (y-axis) and (c) MASP-3 (x-axis) and MAp44 (y-axis). The drawn lines indicate the linear regression fit. The rs value is the non-parametric Spearman correlation coefficient. Note differences in range of axes.
