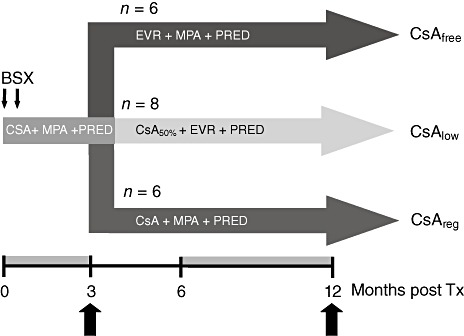
Fig. 1.

Study arms. The three study arms and their patient numbers are depicted. The orange-tinted parts of the time-line indicate time-periods in which samples were collected for fluorescence activated cell sorter (FACS) analysis and the block arrows the time-points at which expression data were used for statistical analysis. BSX, basiliximab; CsA, cyclosporin A; EVR, everolimus; MPA, mycophenolate sodium; PRED, prednisone; 144 × 123 mm (300 × 300 dots per inch).
