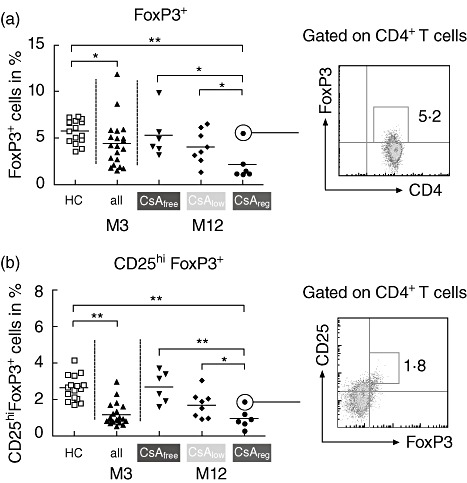
Fig. 2.

Longitudinal development of percentages of CD4+ regulatory T cells (Tregs) in the three treatment arms. The percentages of expression of forkhead box protein 3 (FoxP3) (a) and CD25hiFoxP3 (b) are shown after gating on the CD4+ T cell subset and summarized as scatter-plots with mean. Dot-blots on the right depict representatives of each Treg subset. The asterixes represent statistical significance (*P < 0·05; **P < 0·01); 123 × 88 mm (300 × 300 dots per inch).
