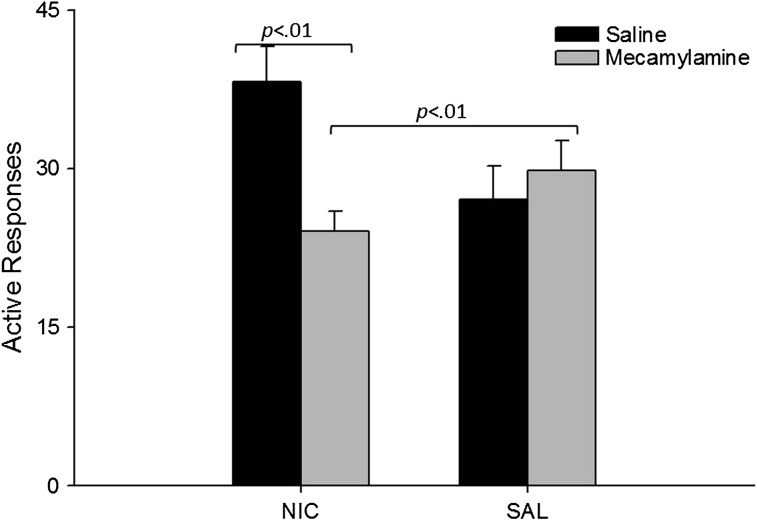
Figure 2.
Mean active responding for the visual stimulus during sessions preceded by mecamylamine or saline (counterbalanced) for Experiment 1 are presented as a function of minipump solution. Black bars correspond to data from animals exposed to pre-session saline, and the gray bars correspond to pre-session mecamylamine. Error bars represent the SEM. Although not presented, active responses were greater than inactive responses (p < .001), and there were no significant interactions or main effects when data analysis was restricted to inactive responding.

