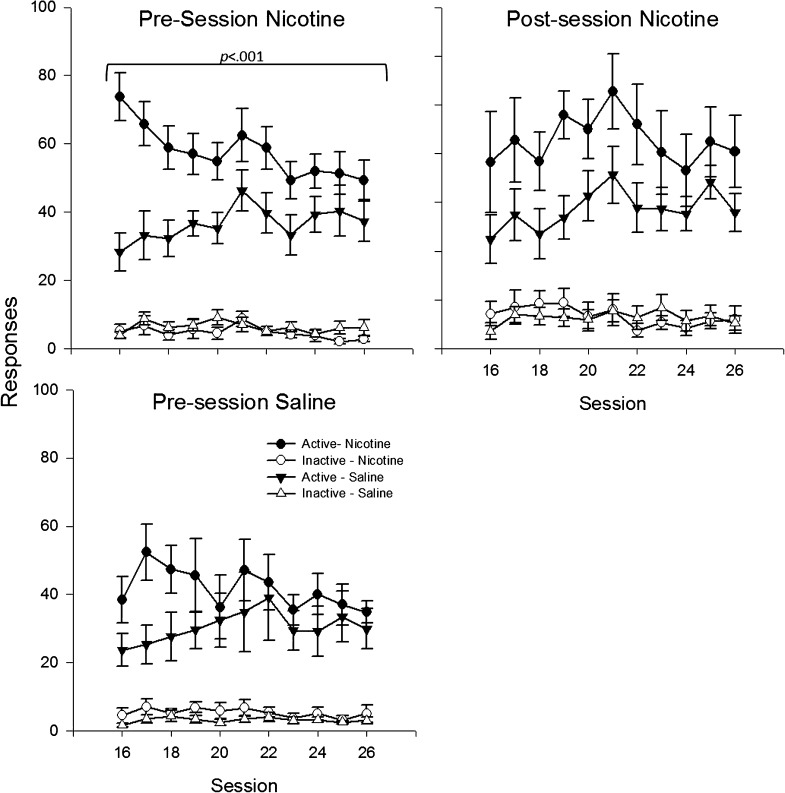
Figure 4.
Mean active and inactive responses for the visual stimulus during the chronic phase of Experiment 2 are presented as a function of session. Data are presented separately for each acute injection condition and are labeled accordingly. Circles represent data from groups that received nicotine-filled minipumps, and triangles indicate groups that received saline-filled minipumps. Filled symbols indicate active response data and open symbols inactive response data.

