
Figure 3.
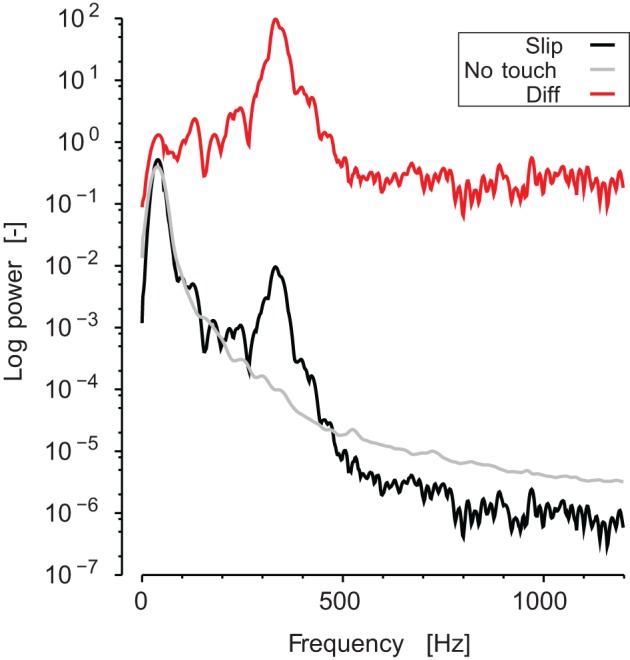
Typical spectrum of the sound recorded. Black line represents the averaged spectrogram during a slipping phase. Gray line represents the averaged spectrogram during a static no-touch phase. Red line is the ratio, which appears as a shift in log coordinates.