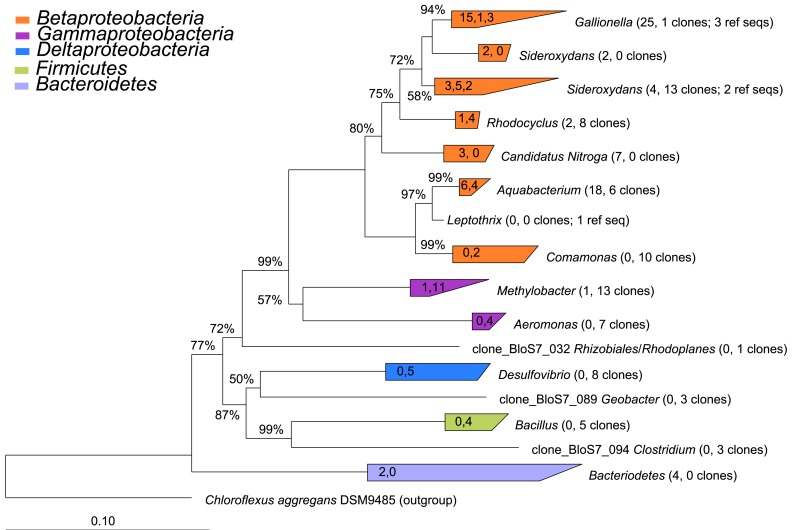
Figure 6.
Phylogenetic tree constructed from 16S rRNA gene clones from sites 2 (microbial mat) and 7 (puffball). The number of clones from each of sites 2 and 7 and the number of reference sequences (where used) are indicated beside each taxon in parentheses (number of site 2 clones, number of site 7 number of clones; number of reference sequences). The values in the triangles indicate the number of unique clones from each site and the number of reference sequences used to construct the tree in arb, respectively (values separated by commas). The tree was prepared using neighbor joining analysis with Jukes–Canter correction. Percentages on nodes represent 1000 bootstrap analyses; only values greater than 50% are shown. More details on major taxa identified in each sample are provided in Table 3.

