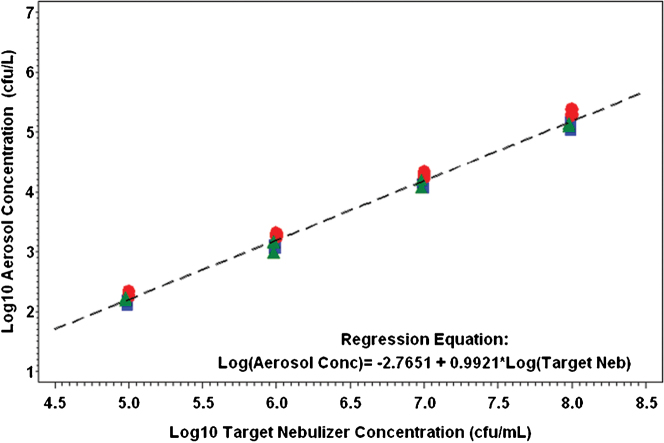
Figure 1. Relationship between aerosol concentration and target nebulizer concentration.
The enumerated aerosol concentration was plotted against the targeted nebulizer concentrations for all three spray factor test days. Blue square = Day 1; red circle = Day 2; Green triangle = Day 3; The mean spray factor for all 12 aerosol disseminations was 1.53E-06 (95% CI = 8.68E-07, 2.68E-6).

