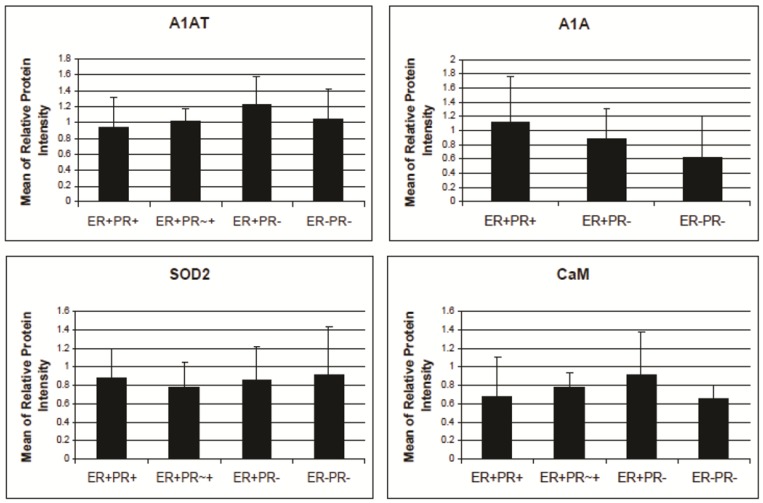
Figure 7.
A1AT, A1A, SOD2, and CaM's expression level in breast cancer tissues. There is no significant difference among the expression level of any of these proteins in any of the presented cancer samples. The relative protein intensity was produced by Adobe Photoshop 6.0 by comparing their absolute intensity to B-actins from all Western blot trials. The absolute intensity for each protein in each sample was calculated by multiplying the mean and pixels of the band. Error bars represent a 95% confidence interval calculated from the standard deviation of each sample. ER+PR+ represents estrogen receptor and progesterone receptor positive breast cancer tissue sample. ER+PR~+ represents a breast cancer tissue sample with ER+ and PR weakly positive.

