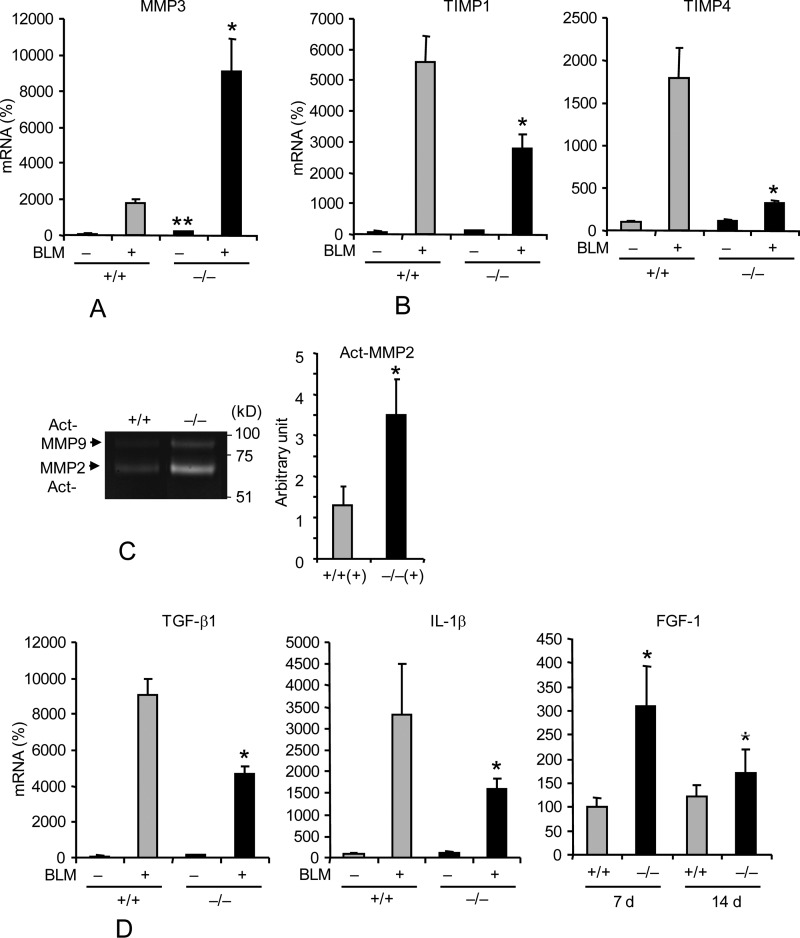
FIGURE 2.
Pin1 regulates the expression of MMPs, TIMPs and fibrogenic growth factors in the lung. A, B, and D, qPCR analysis of ECM expression in the lung of control and BLM-challenged mice on day 14. **, p < 0.05 between vehicle-treated wild type and knockout. The FGF-1 mRNA data in D were all from BLM-treated mice (days 7 and 14). C, MMP2 (66 kDa) and MMP9 (84 kDa) bioactivity in BAL (n = 4–5) measured by zymography. NS, nonspecific bands. Right, ImageJ quantification of specific bands. *, p < 0.05 by Student's t test in a two-tailed analysis. Data shown are representative of three independent experiments and are expressed as the mean ± S.D. (error bars) of eight animals.

