FIGURE 2.
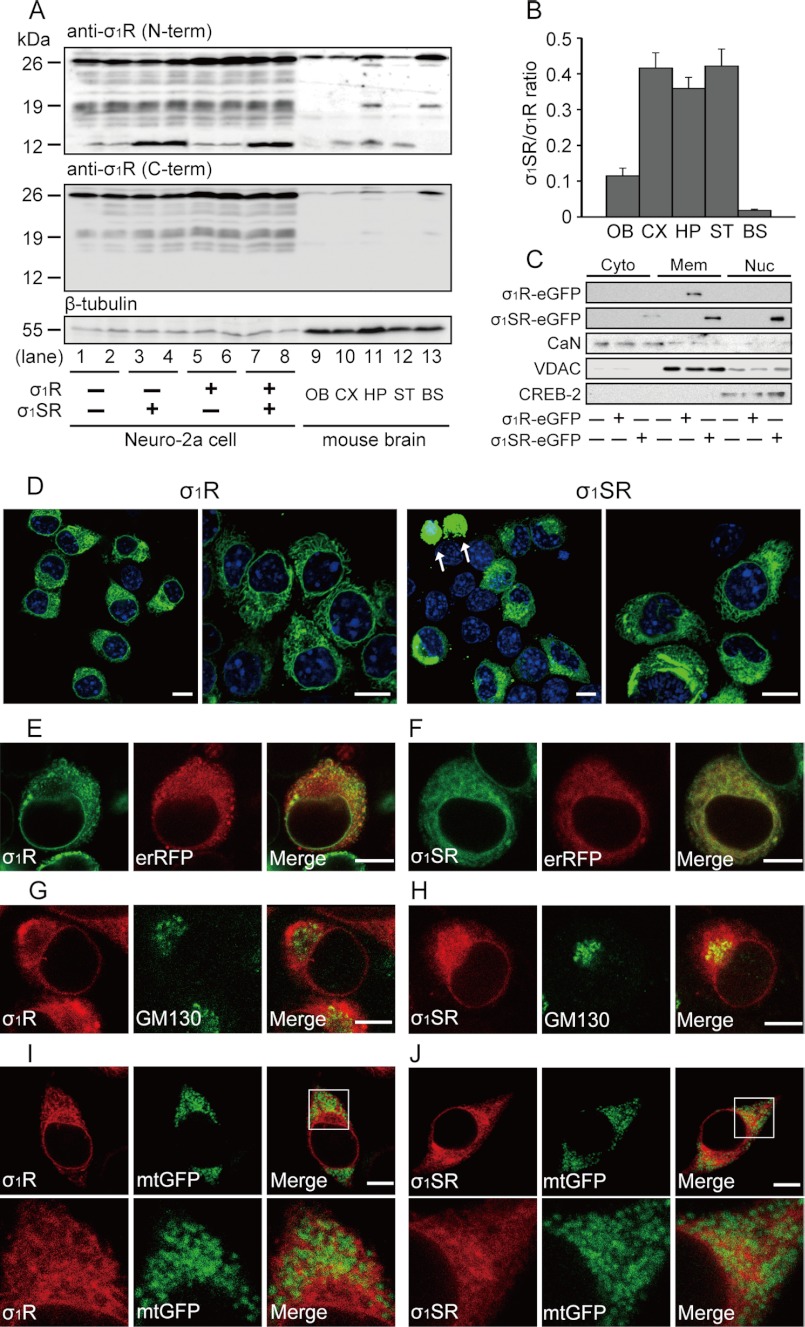
Tissue distribution and localization of σ1Rs. A, representative immunoblots probed with antibodies against the σ1R N-terminal cytosolic domain (upper panel) or the C-terminal lumenal domain (lower panel). As control bands, extracts from Neuro-2a cells transfected with σ1R and σ1SR constructs (lanes 1–8) are shown. B, quantitative densitometry shows the ratio of σ1SR to σ1R protein expression among different brain regions. OB, olfactory bulb; CX, cortex; HP, hippocampus; ST, striatum; BS, brainstem. n = 4 in each group. C, cytosolic (Cyto), ER, mitochondrial membrane (Mem), and nuclear (Nuc) fractions from eGFP tagged-σ1R isoform-transfected Neuro-2a cells were blotted with antibodies against GFP, calcineurin (CaN, cytosolic marker), voltage-dependent anion channel (ER and mitochondrial membrane marker), and CREB-2 (nuclear marker). D–I, σ1R localization in Neuro-2a cells. Confocal images show co-localization of fluorescence (eGFP or mCherry)-tagged-σ1R isoforms and markers of ER (erRFP), Golgi apparatus (GM130), and mitochondria (mtGFP). D, σ1R-eGFP (left) and σ1SR-eGFP (right) are mainly expressed in perinuclear regions. A small number of GFP aggregates are detected in nuclei of σ1SR-eGFP-expressing cells (shown by arrow). Right panels are high magnification images. E and F, immunoreactivity of both σ1R-eGFP isoforms (green) and erRFP (red) almost completely merge. G and H, GM130 (green) immunoreactivity co-localizes with σ1SR-mCherry (H) (red) but not with σ1R-mCherry (G) (red). I and J, both mCherry-tagged σ1R isoforms (red) were detected in a few overlays with the mitochondrial marker mtGFP (green). Lower panels in I and J are high magnification images. Scale bars, 10 μm.

