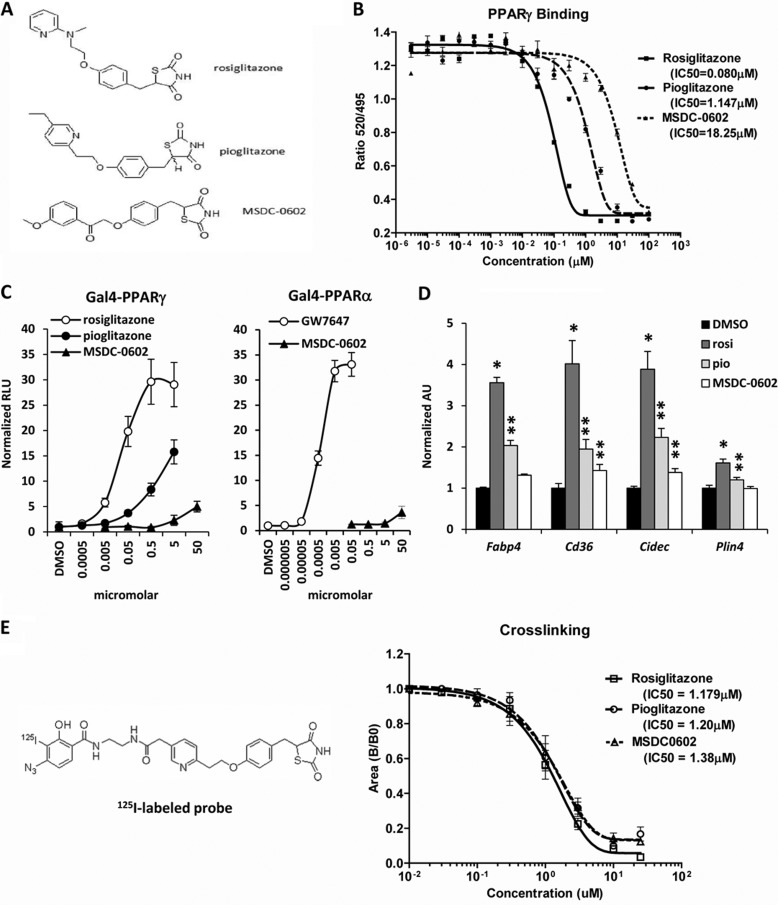
FIGURE 1.
Chemical structure of MSDC-0602. A, the chemical structures of rosiglitazone, pioglitazone, and MSDC-0602 are shown. B, the graph depicts the binding of the indicated TZDs to recombinant PPARγ protein in a Lantha-Screen TR FRET competitive binding assay. The results of one representative experiment (of three) are shown, and each point represents the average of three samples. C, the graphs represent the results of mammalian one-hybrid assays using Gal4-PPARγ or Gal4-PPARα expression constructs cotransfected into HepG2 cells with a UAS-TK-luciferase reporter. Values are expressed as raw luciferase units (RLU) and represent the average of three independent experiments performed in triplicate. D, the expression of the PPARγ target genes in 3T3-L1 adipocytes 48 h after the induction of differentiation and treatment with 0.1 μm concentrations of the indicated TZDs is shown. *, p < 0.05 versus DMSO control. **, p < 0.05 versus DMSO control and rosiglitazone-treated cells. rosi, rosiglitazone; pio, pioglitazone. E, the affinity of the indicated TZDs for mitochondrial binding is depicted in the graph, and the chemical structure of the cross-linker is shown. The results of one representative experiment (of three) are shown, and each point represents the average of three samples.

