FIGURE 3.
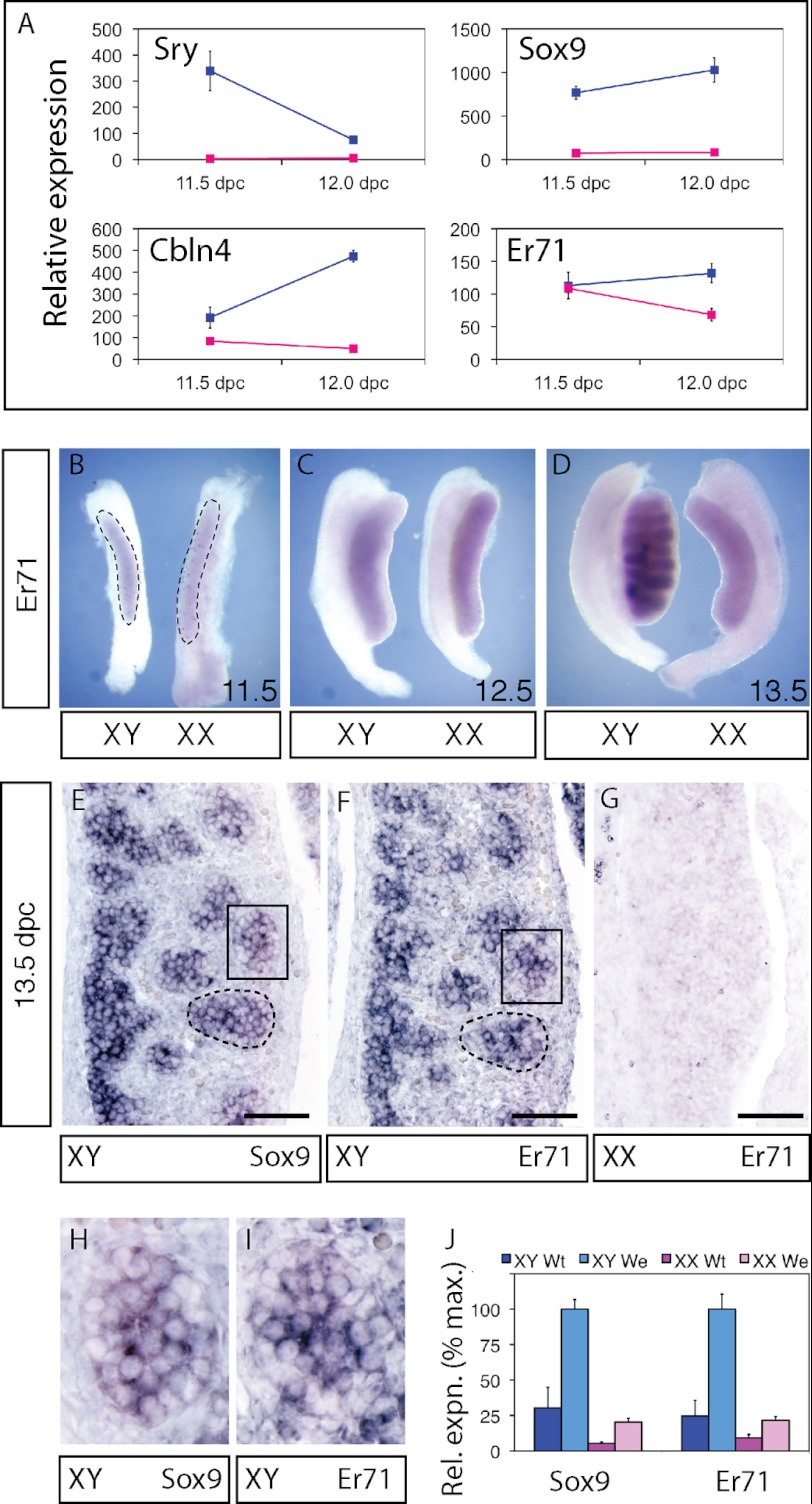
Expression of Er71 in 11. 5–13.5 dpc mouse gonads. A, microarray expression data for Sry, Sox9, Cbln4, and Er71 in gonad samples at 11.5 dpc and 12.0 dpc. XY samples are shown in blue, XX samples in red. Whole-mount in situ hybridization for Er71 in developing testes and ovaries at (B) 11.5 dpc, (C) 12.5 dpc, and (D) 13.5 dpc. The extent of the gonad tissue within the gonad/mesonephros complex is outlined in B. Section in situ hybridization for Sox9 (E) and Er71 (F) in XY 13.5 dpc gonads and for Er71 in XX 13.5 dpc gonads (G). Testis cords are outlined (E, F); scale bar, 100 μm. Areas marked with rectangles are shown at higher magnification (H, I). J, quantitative RT-PCR analysis of Sox9 and Er71 expression in wild-type (wt) and We gonads at 13.5 dpc.

