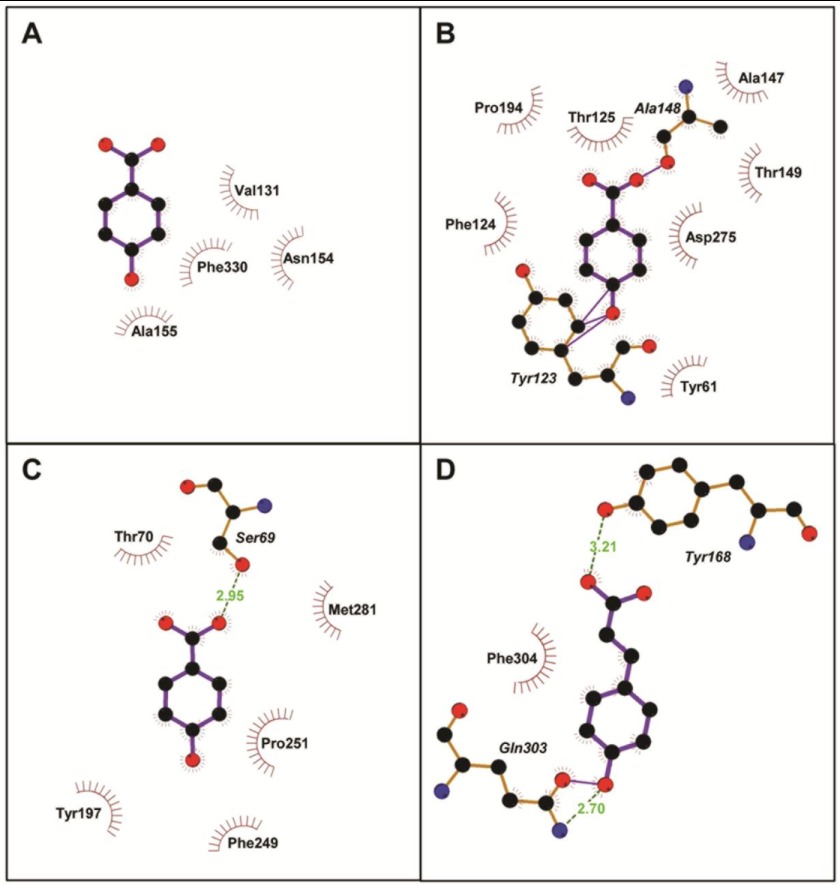
FIGURE 8.
Two-dimensional representation of RPA0668 (A), RPA0985 (B), and RPA4029 docked with 4-hydroxybenzoate (C), and RPA1789 with p-coumarate (D), generated by PDBsum. The server uses LigPlot to determine protein-ligand interactions. Accordingly, residues involved in hydrophobic contacts are represented by semicircles with spokes pointing toward the ligand atoms. The contacted atoms are also shown by spokes radiating back to the ligands. Hydrogen bonds are denoted by green dashed lines, and van der Waals interactions are indicated by solid lines.

